| The Wagner Daily ETF Report for September 11 |
| By Deron Wagner |
Published
09/11/2007
|
Stocks
|
Unrated
|
|
|
|
The Wagner Daily ETF Report for September 11
A bullish pre-market report from semiconductor giant Intel Corp. caused stocks to gap up yesterday morning, but the excitement was short-lived. Traders sold into strength throughout the first half of the day, pushing the stock market firmly lower, but modest buying interest lifted stocks off their lows in the afternoon. In the end, the major indices settled the indecisive session mostly lower. The Dow Jones Industrial Average eked out a gain of 0.1%, as the Nasdaq Composite and S&P 500 fell 0.3% and 0.1% respectively. As they did when the current market correction began in July, small and mid-caps showed the most relative weakness. The Russell 2000 lost 0.8%, while the S&P Midcap 400 declined 0.7%. All of the main stock market indexes closed near the middle of their intraday ranges, indicative of a lack of direction into the close.
Trading activity eased across the board. Total volume in the Nasdaq came in 5% below the previous day's level. Volume in the NYSE declined 8%. The lower turnover enabled both the S&P and Nasdaq to dodge what would have been their third "distribution days" within the past four days. Market internals were negative, but not by a wide margin. Declining volume in the NYSE exceeded advancing volume by just over 2 to 1. The Nasdaq adv/dec volume ratio was only fractionally negative.
In yesterday morning's newsletter, we said that trading would likely be choppy due to the close proximity of short-term support levels in the S&P 500. Specifically, we referred to the fact that the S&P closed last week near support of its prior downtrend line from the July high and its 200-day MA. Oscillating on both sides of the flat line before finishing essentially unchanged yesterday, the S&P 500 was indeed choppy. With just thirty minutes of trading remaining, it looked as though the S&P would close back above its 200-day MA, but traders sold into strength in the final minutes, causing yesterday's high to coincide with resistance of the 200-day MA. Coincidentally, the 200-day MA has also converged with resistance of the hourly downtrend line on the S&P 500.
For short-term traders, the hourly timeframe often provides the most useful reference at determining clear areas of short-term support and resistance. Notice how the S&P 500 perfectly reversed lower after hitting its hourly downtrend line yesterday (moving averages removed so you can more easily see the trendline):
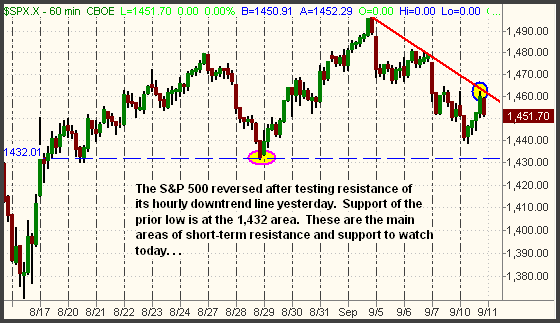
A rally above yesterday's high would push the S&P above resistance of both its hourly downtrend line and its 200-day MA. If that happens, the next major test of resistance will be the 50-day moving average, presently at the 1,484 area. Conversely, a close below yesterday's low would send the S&P down to test support of its prior low of August 28 (the dashed horizontal line).
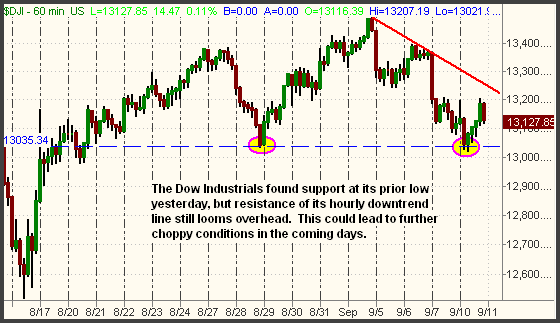
Like the S&P 500, the Dow Industrials has also formed a new hourly downtrend line since the September 4 high. However, yesterday's intraday high still fell shy of touching the trendline. Going into today, resistance of this hourly trendline is in play, though resistance of the 20-day EMA also rests just 20 points above the downtrend line:
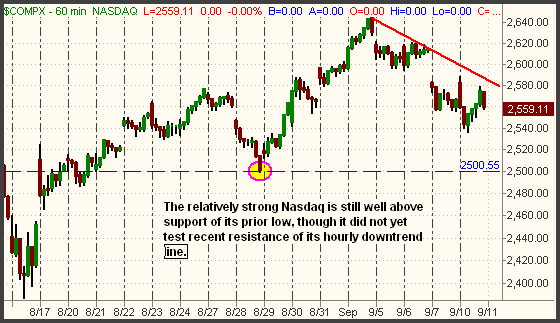
Not surprisingly, the Nasdaq Composite has also formed a clear hourly downtrend line. Although not illustrated below, note that the 40-MA on the hourly chart (2,594) also converges with pivotal resistance of the 50-day MA:
On a technical level, yesterday's action did not change the broad market's overall bias. Both the S&P and Dow remain in intermediate-term downtrends, while the relatively strong Nasdaq is in a sideways range. As for the short-term, our bias is neutral to slightly bearish. Only the long-term primary uptrends remain intact. This will remain the case unless the major indices start to fall below their August 16 lows.
Open ETF positions:
Long - IBB, LQD, DXD, SDS
Short - (none, but DXD and SDS are bearish positions)
Deron Wagner is the Founder and Head Trader of both Morpheus Capital LP, a U.S. hedge fund, and Morpheus Trading Group, a trader education firm launched in 2001 that provides daily technical analysis of the leading ETFs and stocks. For a free trial to the full version of The Wagner Daily or to learn about Wagner's other services, visit MorpheusTrading.com or send an e-mail to deron@morpheustrading.com.
|


 Free Festival of Traders Videos