| The Wagner Daily ETF Report for September 6 |
| By Deron Wagner |
Published
09/6/2007
|
Stocks
|
Unrated
|
|
|
|
The Wagner Daily ETF Report for September 6
As anticipated, overhead resistance of the 50-day moving averages in the S&P and Dow weighed on the stock market yesterday. After gapping lower on the open, the major indices fell further in the first hour of trading, but stabilized and traded in a choppy, sideways range throughout the rest of the session. The resilient Nasdaq Composite held up the best, dropping 0.9%. The S&P 500 lost 1.2% and the Dow Jones Industrial Average fell 1.1%. The small-cap Russell 2000 and S&P Midcap 400 indices were lower by 1.3% and 0.9% respectively. All of the main broad-based indexes settled in the bottom third of their intraday ranges.
Turnover rose across the board, causing both the S&P and Nasdaq to register "distribution days" indicative of institutional selling. Nevertheless, volume increased only modestly. Total volume in the NYSE came in 2% above the previous day's level, while volume in the Nasdaq ticked 4% higher. The Nasdaq's volume has risen in each of the past two days, an "accumulation day" followed by a higher volume "distribution day." However, trading in that exchange still remains below its 50-day average level. In both the NYSE and Nasdaq, turnover has trickled in below average levels for the past twelve consecutive days. The passing of the Labor Day holiday has, so far, only led to a minor increase in trading activity.
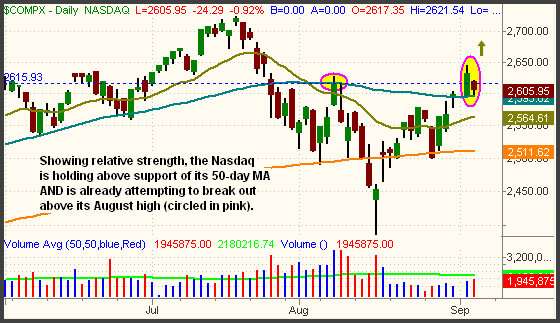
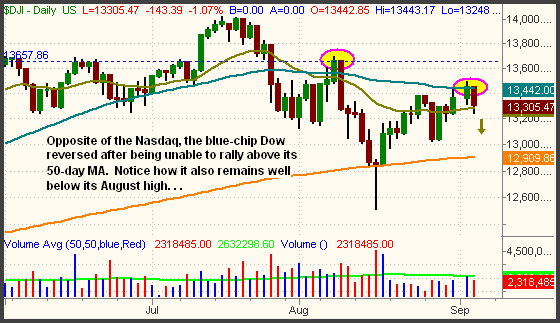
Comparing the technical patterns of the Nasdaq Composite and Dow Industrials, we see a tale of two different markets shaping up. The most noticeable difference is that the Nasdaq has broken out above its 50-day MA, which also acted as support during yesterday's drop. Conversely, resistance of the 50-day MA perfectly marked the high of the Dow's bounce on Tuesday, which subsequently lent a hand in yesterday's broad-based decline. The Nasdaq is also very close to breaking out above its August high, but the Dow is not. Compare the daily charts of the two indexes below:
Drilling down to the shorter-term hourly charts, one will quickly see another big difference between the two indexes. The Dow closed below support of its hourly uptrend line (from the August 16 low), but the Nasdaq is still well above it. Further, the Dow is back below its August 24 high, but the Nasdaq is still above it. We've removed the moving averages on the hourly charts below so that you can more easily see the trendlines:
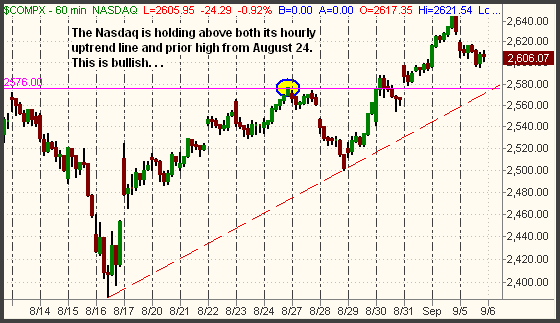

As you can see, the bullish divergence in the Nasdaq is apparent on multiple time frames. As such, the Nasdaq will most likely do the heavy lifting if the overall market attempts to climb higher. Even if further downward momentum builds on yesterday's broad-based losses, the Nasdaq should drop at a much slower pace than the Dow and S&P. Although not illustrated above, the chart pattern of the S&P 500 resembles the Dow, as both are stuck below their 50-day MAs. But unlike the Dow, the S&P 500 is still (barely) above lower channel support of its hourly uptrend line off the August 16 low.
Putting it all together, the divergence and tug-of-war within the broad market could result in choppy trading conditions in the coming days. To combat this, consider positioning yourself on both sides of the market by selling short an industry sector or index with relative weakness (such as the Dow), while simultaneously being positioned long in a sector with relative strength (such as the Nasdaq). If the broad market makes a clean and decisive break in either direction, one can simply cut the positions on the opposite side and/or get heavier in the direction of the trend. Alternatively, sitting in cash and watching from the sidelines is never a bad idea when the stock market is at an inflection point.
Following our own advice, we now have a mix of long and short ETF positions. We took profits on our OIH long position yesterday, then subsequently sold short the Dow Industrials when it broke support of its hourly uptrend line. Rather than selling short the DIAMONDS (DIA), we bought the inversely correlated UltraShort Dow 30 ProShares (DXD). Despite the weakness in the broad market, each of our other long positions in Biotech (IBB) and Fixed-Income (TLT and LQD) moved higher yesterday.
Open ETF positions:
Long - IBB, DXD, TLT, LQD
Short - (none, although DXD long is a bearish position)
Deron Wagner is the Founder and Head Trader of both Morpheus Capital LP, a U.S. hedge fund, and Morpheus Trading Group, a trader education firm launched in 2001 that provides daily technical analysis of the leading ETFs and stocks. For a free trial to the full version of The Wagner Daily or to learn about Wagner's other services, visit MorpheusTrading.com or send an e-mail to deron@morpheustrading.com.
|


 Free Festival of Traders Videos