| The Wagner Daily ETF Report for August 27 |
| By Deron Wagner |
Published
08/27/2007
|
Stocks
|
Unrated
|
|
|
|
The Wagner Daily ETF Report for August 27
Stocks wrapped up the week on a positive note, as each of the main stock market indexes scored solid gains. Unlike most of the recent "up" days, they also trended steadily higher intraday, rather than simply gapping on the open. The Nasdaq Composite gained 1.4%, the S&P 500 1.2%, and the Dow Jones Industrial Average 1.1%. Both the small-cap Russell 2000 and S&P Midcap 400 indexes matched the Nasdaq's 1.4% advance. All of the major indices finished at their intraday highs, as well as their highest levels of the week. The Russell 2000 showed a bit of relative weakness by closing just below the prior day's high.
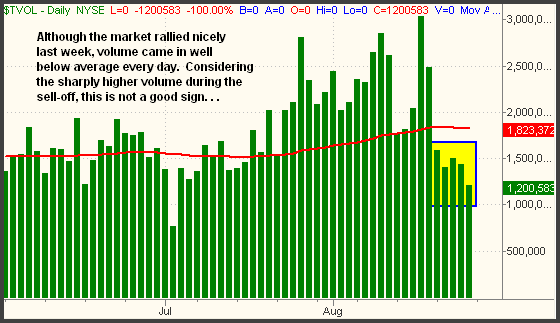
Once again, the action lacked the strong turnover that would have pointed to the return of institutional buying. Total volume in the NYSE fell 14% below the previous day's level, while volume in the Nasdaq was unchanged. In both exchanges, volume was well below 50-day average levels. In fact, it has been throughout most of the bounce off the recent lows. To illustrate this point, let's analyze a daily chart of volume in the NYSE. Below, each of the vertical bars mark the total volume in the NYSE for one full day of trading. The red line is the 50-day moving average:

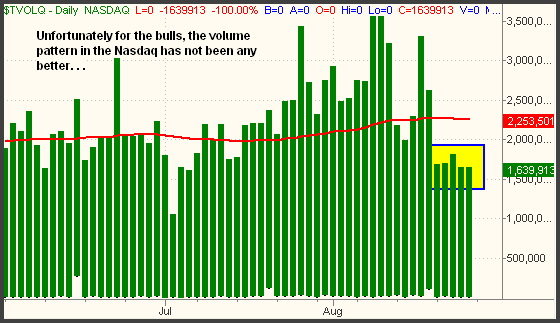
Looking above, the big bar in which volume exceeded three billion shares corresponds with the recent low that was set on August 16. Volume exceeded its 50-day average level the following day, in which the Feds initiated a surprise interest rate cut, but still declined from the prior day. Then, throughout every day last week, stocks trended higher, but on turnover that was well below average. Although stocks registered sizeable gains last Friday, notice how volume also fell to its lowest level in months. It's bearish that volume swelled to well above average throughout the mid-July to mid-August sell-off, then quickly dropped to below average throughout all of last week's bounce. The recent volume pattern in the Nasdaq hasn't been any better:

From the graphs above, it's plain to see that mutual funds, hedge funds, and other institutions dominated the month-long sell-off, but the retracement off the lows has been driven primarily by retail investors. The problem with this scenario is that the entire week's gains can be wiped out by just one instance of institutional selling. Because more than half of the market's average daily volume is the result of institutional trading activity, it's usually a losing proposition to trade against the primary direction of the "smart money." We hate to sound like a broken record, but the lack of volume during last week's rally off the lows should serve as an important warning sign for the bulls.
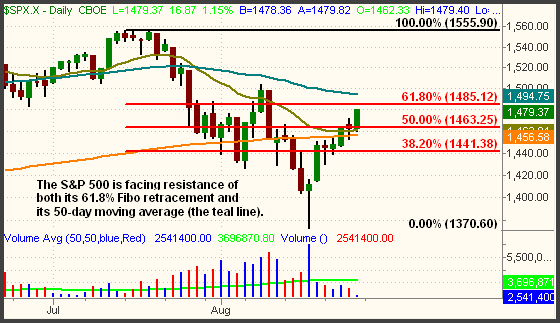
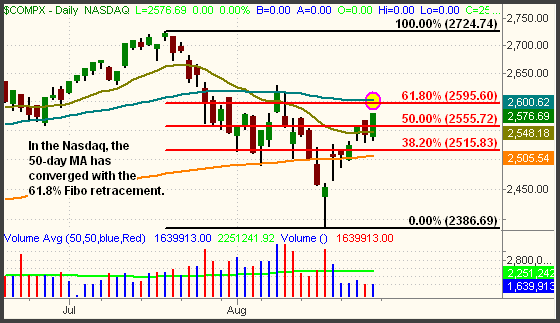
Both the S&P and Nasdaq indices closed above their intermediate-term downtrend lines last Friday, but they are not out of the dark yet. Going into today, the indexes are faced with overhead resistance of both their 61.8% Fibonacci retracements from their July highs down to their August lows. Their 50-day moving averages lie just above that. This is illustrated on the daily charts of the S&P 500 and Nasdaq Composite below:


Generally, the 61.8% retracement level is considered to be the "last line of defense" when an index or stock retraces counter-trend. In the case of a downtrending index, the 61.8% retracement is the level at which an index will either turn back down and resume its primary trend or break out and rapidly zoom back to the prior highs. Only minimal overhead resistance typically remains when a stock or index moves beyond its 61.8% Fibonacci retracement. However, in this case, notice how the 50-day moving averages will also provide additional technical resistance just overhead.
Per last Friday's commentary, we bought the iShares 20+ year Treasury Bond Fund (TLT) when it rallied above its prior high and 200-day MA. The other long setup we pointed out, the Oil Service HOLDR (OIH), also performed well. Though it did not provide a pullback entry, it rallied more than 3 points, closing right at its 50-day MA. Due to its relative strength, this sector may become one of the leaders if the market continues moving higher. We also remain long both DXD and SDS, with stops just below their 50-day MAs.
Open ETF positions:
Long - TLT, SDS, DXD
Short - (none)
Deron Wagner is the Founder and Head Trader of both Morpheus Capital LP, a U.S. hedge fund, and Morpheus Trading Group, a trader education firm launched in 2001 that provides daily technical analysis of the leading ETFs and stocks. For a free trial to the full version of The Wagner Daily or to learn about Wagner's other services, visit MorpheusTrading.com or send an e-mail to deron@morpheustrading.com.
|