| The Wagner Daily ETF Report for August 24 |
| By Deron Wagner |
Published
08/24/2007
|
Stocks
|
Unrated
|
|
|
|
The Wagner Daily ETF Report for August 24
Stocks got off to a winning start yesterday morning, but traders sold into resistance of the downtrend lines on the S&P and Nasdaq, causing the opening gains to quickly evaporate. Still, most of the main stock indexes held up pretty well. The Dow Jones Industrial Average was unchanged, the S&P 500 lost just 0.1%, and the Nasdaq Composite slipped 0.4%. Relative weakness in small-caps caused the Russell 2000 to lose 1.3%. The S&P Midcap 400 was lower by 0.5%. With the exception of the Russell, which finished near its low, all of the major indices closed just below the middle of their intraday ranges.
The bright spot of yesterday's session is that the market's losses occurred on slightly lower turnover. Total volume in the NYSE declined by 5%, while volume in the Nasdaq came in 11% below the previous day's level. The lighter volume declines enabled the S&P and Nasdaq to sidestep a "distribution day." Considering that both indexes registered bullish "accumulation days" the previous day, yesterday's volume pattern was generally positive. In both the NYSE and Nasdaq, declining volume only marginally exceeded advancing volume.
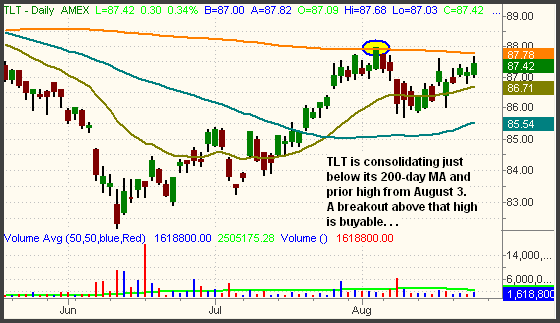
Since several of the major indices have rallied into resistance of their intermediate-term downtrend lines, there are very few ETFs that look attractive on the long side. But there is one group of ETFs not tied directly to the price action of the stock market and which may be poised for further gains -- the fixed-income (bond) ETFs. Because the price of bonds is inversely correlated to interest rates, the recent speculation on further reduction of interest rates has had a positive impact on the price of the bond ETFs. Many of them are breaking out of downtrends and consolidating at their highest levels in months. The iShares 20+ Year Treasury Bond Fund (TLT) is one such example. Take a look at its daily chart:

Since mid-June, TLT has been trending higher. In the beginning of August, it ran into resistance of its 200-day MA, but it gently pulled back after doing so, never falling below support of its intermediate-term uptrend line. Over the past week, TLT has been consolidating right below its 200-day MA and prior high from earlier in the month. If it breaks out above its August 3 high, and hence the 200-day MA, momentum should carry it significantly higher in the short to intermediate-term. As such, we are stalking TLT for a potential long entry over the August 3 high.
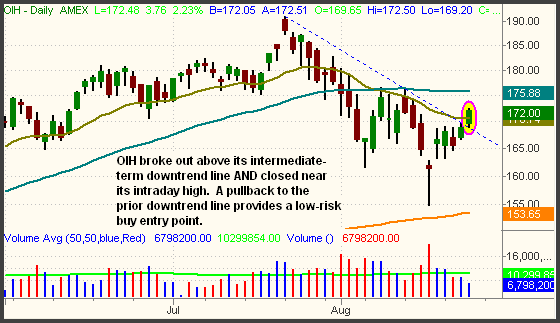
The Oil Service HOLDR (OIH) broke out above its intermediate-term downtrend line yesterday, and also closed near its intraday high:

The prior downtrend line that OIH rallied above yesterday (the blue descending line) should now act as support on a pullback. If OIH retraces back down to near yesterday's low (and the prior downtrend line), it will provide a low-risk entry on the long side. A protective stop can be placed about 1 - 1.5 points below the low. Waiting for such an entry provides one with minimal downside risk and substantial upside profit potential (positive risk/reward ratio). In the current market environment, it is safer to buy a pullback to support than a breakout above resistance because breakouts have a higher rate of failure in downtrending markets. If the major indices start heading back down to their prior lows, OIH will probably move lower as well. However, the stocks in this sector are also tied (in part) to the price of spot crude oil. Therefore, an ETF such as OIH can provide traders with a position that has a lower level of correlation to the S&P, Nasdaq, and Dow.
In yesterday's newsletter, we illustrated resistance of the intermediate-term downtrend lines on the S&P and Nasdaq. We said of them, "At the very least, one should expect an intraday probe above these downtrend lines today. At key support and resistance levels, the specialists typically run stops that investors place at obvious levels. However, it's the actual closing price that matters." Not surprisingly, that's exactly what happened. Both indexes gapped above those trendlines on the open, but sold off to close below them. Going into today, those downtrend lines remain key levels of resistance to watch closely. If the indexes manage to close firmly above yesterday's highs, it could signal a positive change in the market's bias, but the major indices clearly remain in intermediate-term downtrends until that happens.
Open ETF positions:
Long - SDS, DXD
Short - (none)
Deron Wagner is the Founder and Head Trader of both Morpheus Capital LP, a U.S. hedge fund, and Morpheus Trading Group, a trader education firm launched in 2001 that provides daily technical analysis of the leading ETFs and stocks. For a free trial to the full version of The Wagner Daily or to learn about Wagner's other services, visit MorpheusTrading.com or send an e-mail to deron@morpheustrading.com.
|