|
The Wagner Daily ETF Report for August 15
After an uneventful two-day pause, stocks resumed their intermediate-term downtrends yesterday, causing several of the benchmark indexes to finish at fresh August lows. This time, there was not even an opening gap. The broad market began the day flat, then simply trended steadily lower throughout most of the session. Upon testing support of their August lows at mid-day, a few of the major indices attempted to reverse, but the rally was short-lived. The S&P 500 plunged 1.8%, the Nasdaq Composite 1.7%, and the Dow Jones Industrial Average 1.6%. The small-cap Russell 2000 showed relative weakness again, sliding 2.2%. The 1.9% loss in the S&P Midcap 400 wasn't much better. All of the major stock market indexes finished at their intraday lows, while some of them also set new multi-month lows.
Total volume in the NYSE increased 5% over the previous day's level, causing the S&P 500 to register a "distribution day." A 10% decline in Nasdaq turnover enabled that exchange to dodge the bearish label. In bullish markets, we count the number of "distribution days" in order to measure bouts of institutional selling. When the broad market registers four or more days of higher volume selling within a period of several weeks, it provides a highly reliable warning sign that the market may be reversing. However, it's largely irrelevant to maintain a rolling count of "distribution days" in a downtrending market because many "down" days in a weak market are going to be on higher volume. Instead, we are now looking for sessions of higher volume gains ("accumulation days") in order to determine the first signs of institutional buying. Unfortunately for the bulls, they have been non-existent lately.
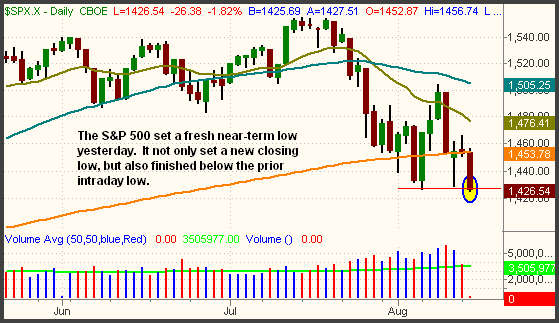
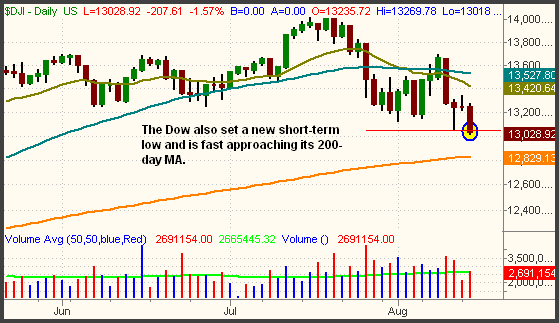
Several key technical events occurred yesterday. Perhaps most importantly, both the S&P 500 and Dow Jones Industrial Average broke down to new short-term lows. Both indexes not only fell to new closing lows, but also finished below the prior intraday lows. This is shown on the daily charts of the S&P and Dow below:


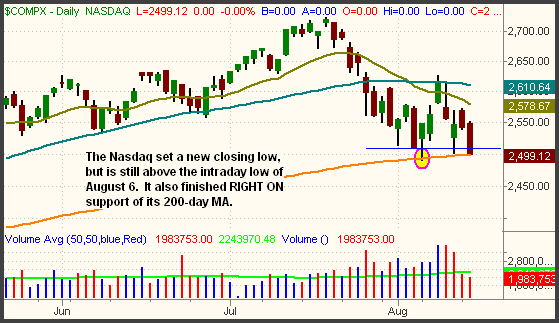
The Nasdaq Composite set a new closing low, but held a few points above the intraday low of August 6. Notably, the index also closed right on its 200-day moving average. With the S&P 500 now well below its 200-day MA, traders will be watching to see whether or not the Nasdaq follows suit over the next few days:

In yesterday's The Wagner Daily, we used the weekly charts to illustrate the next major levels of support in the S&P and Nasdaq. To recap, this is basically the significant lows from March of this year. For the S&P 500, that area is around 1,387. The 2,368 area is support of the March weekly closing low in the Nasdaq. Given yesterday's technical damage, realize there is not much horizontal price support to prop up the S&P and Nasdaq above those levels.
With each of the "big 3" stock market indexes sitting at new closing "swing lows," and the next major support levels quite a bit lower, the long side of the market now carries a lot of risk. Going into yesterday, the possibility remained that the previous two days of stabilization could lead to another leg up, but the sell-off quickly laid that idea to rest. Yesterday's weakness was broad-based, essentially spreading into every major industry sector. Even the Semiconductor Index ($SOX), which was poised to pop back above its 50-day MA, rolled over again. This nixed the setup of a short-term momentum buy in the Semiconductor ETFs.
Frankly, we don't see anything on the long side of the market that looks appealing. Even if the market bounced today, we have not come across any ETFs we would be comfortable buying. This tells us that our best play now is to wait for the next decent upward retracement in the market, then initiate new short positions on the ETFs with the most relative weakness. This is what we did with our short entries in the Russell 2000 and Dow Industrials, which we entered on August 8 and 9 respectively. Waiting for the bounce that culminated on August 8 enabled us to get new short entries at a level that provided a positive risk/reward ratio.
Around mid-day yesterday, the broad market attempted to reverse higher, due to support of the August lows in several of the major indices. When this occurred, we made a judgment call to take profits on partial share size of our positions in the Short Russell 2000 (RWM) and UltraShort Dow Industrials (DXD). The reversal attempt obviously failed, and the market went on to new lows, but that's okay because we remain short half our original share size in both indexes. Tight trailing stops from here will allow us to realize maximum gains on any further short-term losses in the broad market, while simultaneously locking in most of the existing profit. Separately, the short setup in the Oil Service HOLDR (OIH), which we illustrated in yesterday's commentary, triggered in the final few minutes of trading. The long position in the PowerShares Clean Energy (PBW) hit its trailing stop, locking in a small gain.
Just four days ago, PBW broke out to a new all-time high, on strong volume. As such, it was a bit surprising that it retraced so much of its recent gain. In hindsight, we could have sold into strength for a nice profit when PBW gapped to a new high, but our initial plan was to make it an intermediate-term trade, not a short-term momentum trade. Further, stocks and ETFs at new highs typically continue to go much higher. Keeping too tight of a stop on breakouts severely limits upside profit potential under bullish or even neutral broad market conditions. However, we are no longer in a neutral market. Rather, it's become apparent that even the strongest of breakouts are failing under the current overall market weakness.
When you have a good trade setup, but the overall stock market doesn't cooperate, there's not really much you can do about it. Fortunately, we maintained a logical trailing stop with PBW because didn't want a solidly profitable trade to turn into a losing trade. We also will keep it on our radar for possible re-entry. We expect it to be one of the first ETFs to bounce back to its highs when the market eventually finds a bottom, or at least shows some signs of doing so. Getting back in after it stabilizes is a great way to recapture upside gains, but without taking additional risk on the downside.
Open ETF positions:
Long - RWM, DXD (half positions now)
Short - OIH
Deron Wagner is the Founder and Head Trader of both Morpheus Capital LP, a U.S. hedge fund, and Morpheus Trading Group, a trader education firm launched in 2001 that provides daily technical analysis of the leading ETFs and stocks. For a free trial to the full version of The Wagner Daily or to learn about Wagner's other services, visit MorpheusTrading.com or send an e-mail to deron@morpheustrading.com.
|