| The Wagner Daily ETF Report for August 14 |
| By Deron Wagner |
Published
08/14/2007
|
Stocks
|
Unrated
|
|
|
|
The Wagner Daily ETF Report for August 14
Stocks gapped higher out of the starting gate yesterday morning, but subsequently drifted sideways to lower throughout the day. Selling pressure in the final fifteen minutes of trading caused the broad market to finish near the flat line and its intraday low. The Dow Jones Industrial Average was flat, while both the S&P 500 and Nasdaq Composite surrendered early gains of approximately 1% to finish 0.1% lower. The nearly unchanged S&P 500 left the index glued to its 200-day MA for the third consecutive day. Small-caps resumed their former relative weakness, as the Russell 2000 Index slid 1.1%. Conversely, the S&P Midcap 400 Index managed a gain of 0.2%. Unlike most days of the past several weeks, stocks settled down and traded in a relatively narrow range yesterday.
Sharply lower turnover in both exchanges matched yesterday's calm price action. Total volume in the NYSE declined by 32%, while volume in the Nasdaq came in 33% below the previous day's level. It was the first day in nearly a month that volume fell below 50-day average levels. After last week's frantic pace, traders appreciated being able to catch their breath yesterday. Across the board, market internals were roughly flat.
One sector to keep an eye on is the Semiconductor Index ($SOX). Below is its daily chart:

In each of the past four sessions, the $SOX has tested and attempted to break out above convergence of its 20 and 50-day moving averages. It has failed thus far, but a solid close above that area of resistance could really help the Nasdaq. Such a move could also create a short-term buying opportunity in the Semiconductor ETFs, such as the Semiconductor HOLDR (SMH), but it would still be risky to buy for anything other than a quick momentum pop.
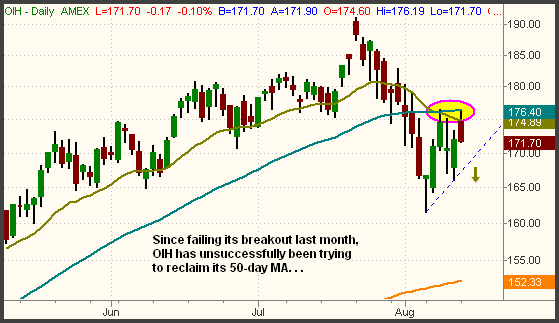
The Oil Service Index ($OSX) fell below its 50-day moving average two weeks ago, but it has tried to move back above it twice over the past week. Yesterday, it probed above convergence of its 20 and 50-day MAs on an intraday basis, but failed to close above it. Because the Oil and Oil Service stocks are heavily weighted, the $OSX is another sector worth keeping on your watchlist. Failure to move back above the 50-MA could have a significant bearish impact on the S&P 500. It also could create a short-selling opportunity in the Oil Service HOLDR (OIH), which we would consider selling short on a break of its hourly uptrend line. This is shown as the dashed ascending blue line on the chart below:

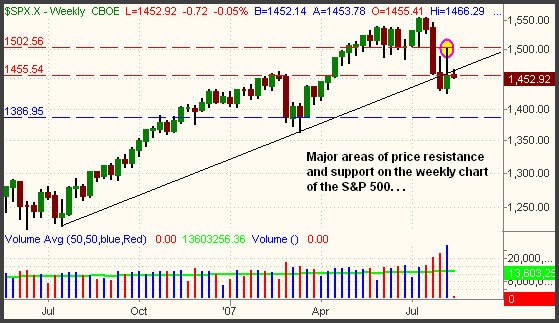
With the wild price swings of the past three weeks, the daily charts of the major stock market indexes have begun to look rather choppy. At times such as these, the longer-term weekly charts smooth out the day-to-day chop and help one to keep the "big picture" in perspective. So, let's take a look at the key areas of price support and resistance for the benchmark S&P 500 Index:

On the weekly chart above, there are three dashed, horizontal lines and one ascending trendline. The black uptrend line begins with the lows of the last major correction in middle of last year. Since the S&P 500 has closed below this trendline for the past two weeks, that level has now become resistance. Next, note the horizontal line at the 1,502 level. This marks major resistance of the prior lows from June. Notice that last week's intra-week high coincided with this level of resistance (circled in pink). The horizontal line at 1,455 marks pivotal support/resistance of the prior highs from February of this year. The index has dipped below that support level for the past two weeks, but it trying to hold it again this week. Finally, the blue horizontal line at the 1,386 level marks the next major area of price support if the S&P 500 breaks down below its recent low of 1,427. Odds are pretty good the index would rapidly drop to support of the 1,386 area if a new August low is set.
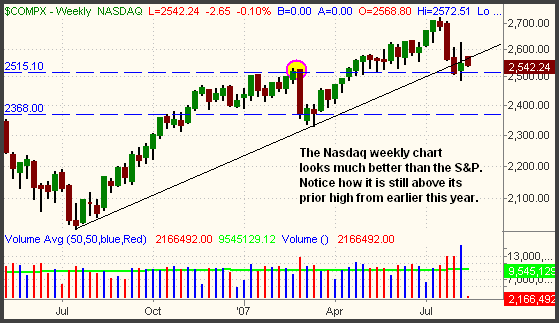
The Nasdaq Composite weekly chart has shown less technical damage than the S&P 500. The Nasdaq is still holding above its prior highs from earlier this year (albeit barely), while toying with support of its primary uptrend line from the mid-2006 low. If the recent lows are broken, the next major area of support is nearly 7% lower. Resistance is last week's high of 2,627. This is illustrated on the chart below:

As the weekly chart of the S&P 500 illustrates, there is a lot of technical resistance the broad-based index is faced with right now. Just as water flowing down a hill will always flow in the path of least resistance, so will the stock market. Therefore, with multiple levels of significant resistance, and just one area of support nearly 5% lower, odds favor the S&P 500 going lower before moving much higher. The intermediate-term bias remains bearish, while the short-term bias is neutral.
Open ETF positions:
Long - RWM, DXD, PBW
Short - (none)
Deron Wagner is the Founder and Head Trader of both Morpheus Capital LP, a U.S. hedge fund, and Morpheus Trading Group, a trader education firm launched in 2001 that provides daily technical analysis of the leading ETFs and stocks. For a free trial to the full version of The Wagner Daily or to learn about Wagner's other services, visit MorpheusTrading.com or send an e-mail to deron@morpheustrading.com.
|