|
The Wagner Daily ETF Report for August 8
The stock market followed through with another round of broad-based gains yesterday, but getting there was quite a wild ride. After opening slightly lower, the major indices recovered and moved marginally higher into the 2:15 pm Fed announcement on economic policy. Immediately following the FOMC commentary, stocks nosedived to new intraday lows, but they whipped back up to new intraday highs less than an hour later. Trading is typically volatile and whippy immediately following Fed announcements. Yesterday's action was certainly no disappointment in that arena! By day's end, both the S&P 500 and Nasdaq Composite had settled 0.6% higher. The Dow Jones Industrial Average gained only 0.3%, but small and mid-cap stocks perked up for a change. The Russell 2000 and S&P Midcap 400 indices rallied 1.0% and 0.8% respectively. A pullback in the final fifteen minutes of trading caused stocks to finish off their best levels, but the gains were still impressive considering how far the market recovered from its afternoon plunge.
Total volume in the NYSE declined by 2%, while the Nasdaq volume was on par with the previous day's level. Still, turnover in the Nasdaq has exceeded 50-day average levels for sixteen consecutive days. Market internals were only slightly positive. In the Nasdaq, advancing volume edged out declining volume by a margin of 1.3 to 1. The NYSE ratio was positive by just under 2 to 1.
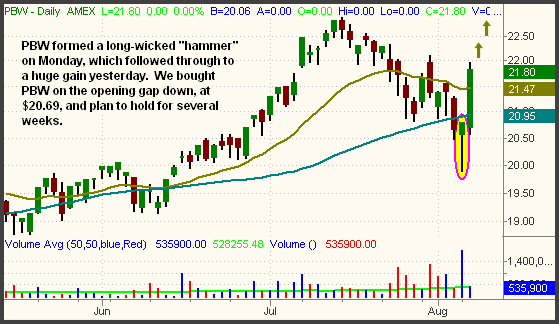
We have mentioned several times over the past two weeks that the PowerShares Clean Energy (PBW) is an ETF with relative strength that should resume leadership as soon as the market stabilizes. As such, we took an updated look at PBW when the broad market formed its bullish reversal day on August 6, and were pleased with what we saw. After closing below its 50-day moving average for just one day, PBW formed a "hammer" candlestick, one with a rather long wick. This bullish pattern is circled on the daily chart below:

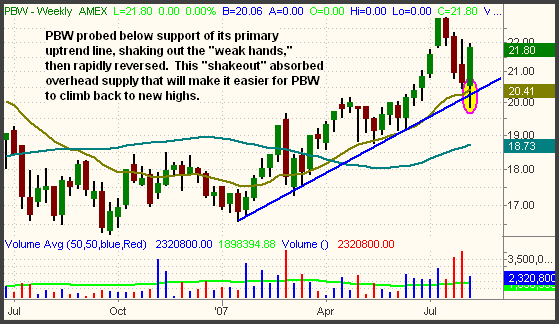
When a "hammer" forms just below a key support level like the 50-day MA, it has the effect of shaking out the "weak hands" so that the stock or ETF can resume its primary uptrend with less overhead supply. After the formation of a "hammer," the following day usually provides a low-risk buy entry point, especially if the upside reversal coincides with a major area of support. Looking at the long-term weekly chart, notice how PBW reversed after dipping below support of its primary uptrend line:

The formation of a long-wicked "hammer," combined with key support of its weekly uptrend line, prompted us to look for an entry point in PBW yesterday morning. We didn't have to wait long, as the small opening gap down provided us with the perfect opportunity to buy. Per intraday e-mail alert to subscribers, we bought PBW ten minutes after the open, at a price of $20.69. The 4.9% gain that PBW subsequently went on to achieve yesterday was the third largest percentage gain of the 551 ETFs we monitor on a daily basis. But unlike the Fidelity Nasdaq Composite (ONEQ), which we intend to sell into strength for a quick gain within the next day or two, we plan to hold PBW as an intermediate-term trade. Given its relative strength and clearly-defined uptrend line, it should be one of the first sector ETFs to rally to a new high as the broad market recovers. Barring any of the major indices suddenly falling to new August lows, our projected holding period for PBW is at least several weeks.
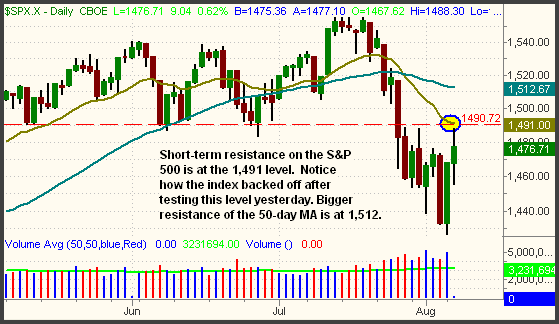
Now that the stock market is at least in bounce mode, let's take an updated look at the short-term resistance levels in the S&P and Nasdaq. In the August 3 issue of The Wagner Daily, we illustrated how the first major level of resistance for the S&P 500 would be found at the 1,490 area, which marked resistance of the prior lows from June. On the daily chart below, notice how the S&P backed off after approaching that level yesterday:

Over the past few days, the 20-day EMA of the S&P has descended, causing it to converge with resistance of the June lows. This confluence, of course, may make it more difficult for the index to move above yesterday's high, at least in the short-term. If the S&P 500 happens to convincingly close above the 1,491 level, expect the 50-day moving average, currently at 1,512, to provide an even more significant level of resistance. Next, check out the Nasdaq Composite:

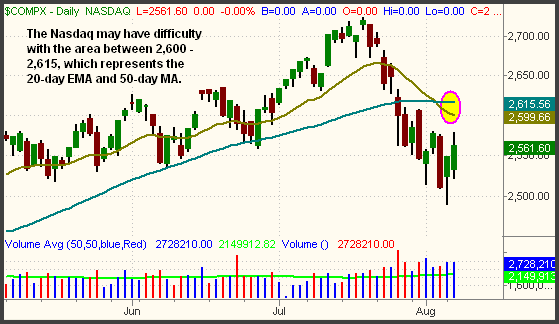
The Nasdaq Composite may recover faster than the S&P 500 because less technical damage has been done to its chart. Unlike the S&P, the Nasdaq only closed below its June lows for one day, not enough to announce a clear break of support. The Nasdaq also held above its 200-day moving average, the test of which was largely responsible for triggering the broad-based bounce two days ago. Significant overhead resistance will be found in the range of 2,600 to 2,615, comprising the 20-day EMA and 50-day MA respectively. It is on a rally into this area that we plan to take profits on ONEQ. If, however, the Nasdaq suddenly heads south today, a tight trailing stop should still enable us to lock in a decent gain. We're avoiding new entries on the short side of the market right now, but this could quickly change if the major indices are unable to at least hold onto their gains of the past two days.
Open ETF positions:
Long - ONEQ, PBW
Short - EEM
Deron Wagner is the Founder and Head Trader of both Morpheus Capital LP, a U.S. hedge fund, and Morpheus Trading Group, a trader education firm launched in 2001 that provides daily technical analysis of the leading ETFs and stocks. For a free trial to the full version of The Wagner Daily or to learn about Wagner's other services, visit MorpheusTrading.com or send an e-mail to deron@morpheustrading.com.
|