|
The Wagner Daily ETF Report for July 24
Stocks gapped higher on yesterday's open, but subsequently managed only to move in a choppy, sideways range before finishing with mixed results. The blue-chip Dow Jones Industrial Average showed leadership by gaining 0.7% and closing in the upper quarter of its intraday range. The S&P 500 and Nasdaq Composite were higher by 0.5% and 0.1% respectively. The small-cap Russell 2000 slipped 0.1% and the S&P Midcap 400 lost 0.2%. The S&P 500 settled in the middle of the day's range, while the Nasdaq closed near its low.
Total volume in the NYSE receded 23%, as volume in the Nasdaq dropped 11% below the previous day's level. There have been two "up" days and two "down" days within the past four sessions. However, both of the "up" days have occurred on declining volume, while both "down" days were "distribution days" indicative of institutional selling. The broad market has basically gone nowhere over the past four days, but a look "under the hood" at the volume patterns discreetly reveals underlying weakness. Because prices continue to hold up pretty well, negative price to volume relationships in the market are not solely enough justification to be bearish on the stock market. Nevertheless, professional traders who monitor underlying internals and volume patterns may begin hovering their fingers over the sell buttons in case prices begin to confirm the early warning signs.
Since we closed out the iPath India Fund (INP) for a nice profit two days ago, we now have five open ETF positions remaining, four of which continue to show unrealized gains since our entries. On a point basis, the short position in the Regional Bank HOLDR (RKH) is showing the greatest gain. Since selling short RKH just four days ago, at a price of 156.87, the trade is currently showing a gain of 5.57 points. Yesterday, one of our subscribers asked if we could explain the technical rationale for entering the trade where we did. Rather than privately replying to the e-mail, we figured it would be a good educational example to discuss in today's commentary.
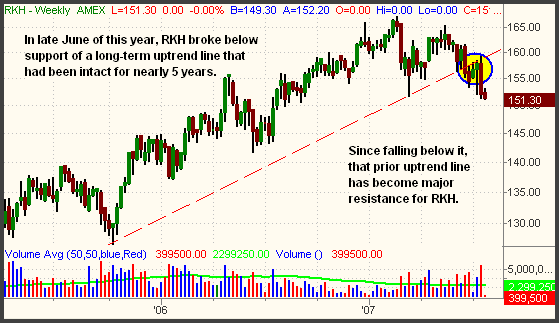
For a long trade setup, one of the biggest things we look for is convergence of several support levels on multiple time frames. For a short trade setup, we like to see the opposite, which is a convergence of resistance levels on multiple time frames. In the case of RKH, a perfect short entry was provided last week when it rallied into major resistance on both its daily and weekly charts. Since longer chart intervals carry more weight than shorter intervals, the first thing we liked was big resistance on the weekly chart of RKH. Specifically, it had rallied into new resistance of its prior uptrend line that it broke below in late June. Notice how RKH was unable to climb back above its prior uptrend line after it fell below it:

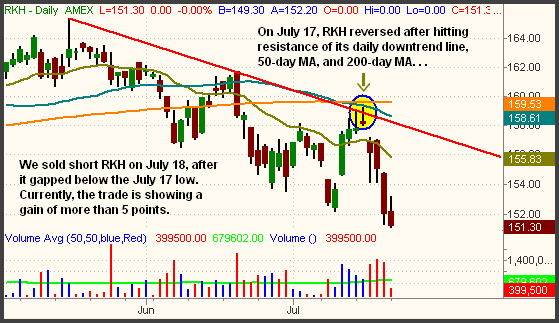
With the break of a four-year uptrend providing the main impetus for the short idea, we drilled down to the shorter-term daily chart. Upon doing so, we were pleased to see that RKH had also rallied perfectly into several resistance levels on that time frame as well. Take a look:

First, notice the intermediate-term downtrend line that is illustrated by the descending red line. On both July 16 and 17, RKH formed bearish "inverted hammer" candlesticks after trying, but failing, to break out above the intermediate-term downtrend line. This alone provided a decent short entry, but it was made even better by the fact that resistance of both the 50 and 200-day MAs converged with the downtrend line as well. Going into July 18, our plan was to sell short RKH on a break of its July 17 low. As you can see, our short entry happened on that day's open. Considering resistance of its prior uptrend line on the weekly chart, combined with overhead resistance of the daily downtrend line, 50-day MA, and 200-day MA, it's not surprising that RKH has rapidly fallen apart over the past few days. Our downside price target in RKH is just a few points below its current level, but we'll be trailing a stop along the way in order to protect the gain while maximizing profits.
As for the broad market, the major indices have entered into a choppy, indecisive range over the past week. Below current prices, clear support for the major indices is at the intraday lows of July 20. This was illustrated in yesterday's Wagner Daily. A convincing break below those levels could send the bulls running, as the S&P would probably break below its 50-day MA shortly thereafter. Conversely, a breakout above the highs of the recent ranges would instantly send the major indices back into new multi-year or record highs that are completely devoid of technical resistance. Stay alert and prepared for either scenario at this critical juncture.
Open ETF positions:
Long - GDX, PBW, FXC, IBB
Short - RKH
Deron Wagner is the Founder and Head Trader of both Morpheus Capital LP, a U.S. hedge fund, and Morpheus Trading Group, a trader education firm launched in 2001 that provides daily technical analysis of the leading ETFs and stocks. For a free trial to the full version of The Wagner Daily or to learn about Wagner's other services, visit MorpheusTrading.com or send an e-mail to deron@morpheustrading.com.
|