| The Wagner Daily ETF Report for July 17 |
| By Deron Wagner |
Published
07/17/2007
|
Stocks
|
Unrated
|
|
|
|
The Wagner Daily ETF Report for July 17
Stocks attempted to build on recent strength by grinding higher yesterday morning, but an afternoon reversal caused most of the major indices to close lower. Small caps showed relative weakness for the second consecutive day, causing the Russell 2000 Index to slide 0.9%. Trailing closely behind was the 0.7% decline in the S&P Midcap 400. Losses in the Nasdaq Composite and S&P 500 were less substantial, coming in at 0.4% and 0.2% respectively. The Dow Jones Industrial Average bucked the trend and continued to show resiliency. The large cap index gained 0.3% and scored a fresh record high for the third straight session. The Dow finished near the middle of its intraday range, while the other major indices settled near the bottom quarter of their ranges.
Turnover ticked marginally higher across the board, causing both the S&P and Nasdaq to register a "distribution day." Total volume in the NYSE was 2% above the previous day's level, as volume in the Nasdaq increased just 1%. With such a small increase in the number of shares changing hands, it's fair to say institutional selling was not overly aggressive. Still, the losses on higher volume were enough for both exchanges to record their third such "distribution days" within the past several weeks. Under the surface, market internals weren't that bad. Declining volume in the NYSE exceeded advancing volume by a margin of just under 2 to 1. The Nasdaq ratio was negative by less than 3 to 2.
Considering the power of last Thursday's broad-based rally, we haven't exactly seen the type of bullish follow-through one would expect from a move of such proportions. Conversely, the market hasn't really been behaving poorly since then either. In yesterday's commentary, we said there were three factors we would be scrutinizing in the event of a pullback: corresponding overall volume levels, whether or not the S&P and Dow hold above their recent breakout levels, and the performance of market-leading stocks. Since slightly higher volume accompanied yesterday's correction, we should consider that to be the first yellow flag since last week's breakout. However, the bullish chart patterns of the major indices remain intact. Most leading stocks also held up well in yesterday's pullback. In the event of a further correction today, let's take a look at the key support levels in the S&P, Dow, and Nasdaq. Below is the daily chart of the S&P 500:
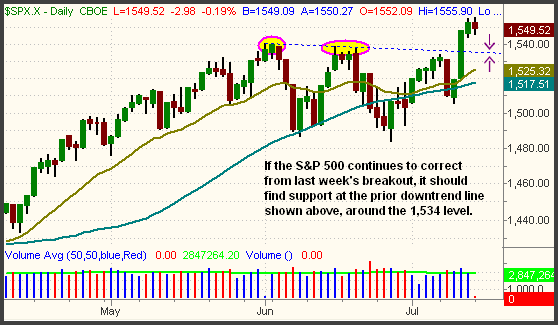
The most basic tenet of technical analysis states that a prior resistance level becomes the new support level after the resistance is broken. As such, the S&P should hold above new support of the prior downtrend line (the blue descending line) in the event of a further retracement. For now, we must consider a pullback to that level (around 1,534) to be a buying opportunity for strong stocks and ETFs. As illustrated yesterday, the PowerShares Clean Energy Fund (PBW) is one such ETF that will present a low-risk buying opportunity if the S&P corrects a bit further.
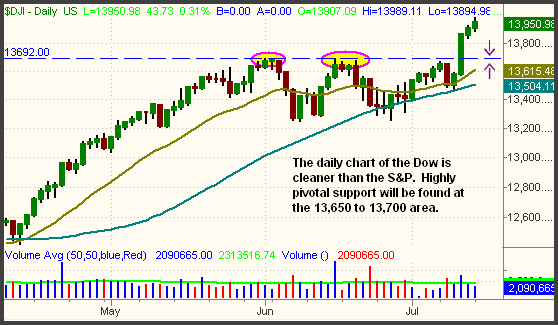
The relatively strong Dow has a cleaner chart pattern than the S&P. Support of the prior highs from last month is in the area of 13,650 to 13,700:
Because the Nasdaq led the S&P and Dow in the market's recent breakout, the index has already formed a "higher high" and subsequent "higher low" since breaking out above its June high. First line of support is the prior high of 2,672 that was set on July 9, while a more pivotal level of support is the prior high of 2,634 from June:
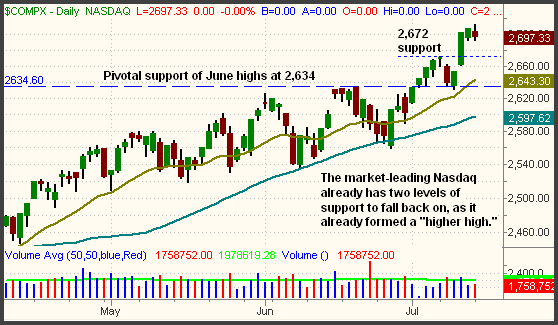
A dip down to the 2,672 area would present an ideal buying opportunity for ETFs such as the Nasdaq 100 Index (QQQQ) and the Semiconductor HOLDR (SMH). However, we would quickly shift to "wait and see" mode if the first line of defense fails to hold. Selling short any of the broad-based indexes remains a bad bet because we can only trade what we see, not what we think! So far, all we see is a modest correction within the context of a strong rally. If the situation changes in the coming days, we will simply re-assess.
The reaction to the onslaught of corporate earnings reports on tap over the next week will be the biggest determinant of whether or not last week's rally will hold up. With quarterly earnings season in full swing, expect greater than usual day-to-day volatility and erratic movements in the broad market. Stay on top of when your stocks are reporting so that you are not blind-sided with the potential for a large opening gap in the wrong direction. Securities broker-dealer leader Merrill Lynch (MER) will attempt to dazzle us with their latest numbers before today's open. Semiconductor giant Intel (INTC) and Internet behemoth Yahoo! (YHOO) are among the companies reporting after the close.
Open ETF positions:
Long - INP, FXC, GDX, IBB
Short - (none)
Deron Wagner is the Founder and Head Trader of both Morpheus Capital LP, a U.S. hedge fund, and Morpheus Trading Group, a trader education firm launched in 2001 that provides daily technical analysis of the leading ETFs and stocks. For a free trial to the full version of The Wagner Daily or to learn about Wagner's other services, visit MorpheusTrading.com or send an e-mail to deron@morpheustrading.com.
|


 Free Festival of Traders Videos