| The Wagner Daily ETF Report for June 20 |
| By Deron Wagner |
Published
06/20/2007
|
Stocks
|
Unrated
|
|
|
|
The Wagner Daily ETF Report for June 20
Stocks recovered from morning weakness yesterday, enabling most of the major indices to close mildly higher. The Nasdaq Composite shook off an early loss of 0.5% to finish less than 0.1% higher. Both the S&P 500 and Dow Jones Industrial Average traded in similar intraday patterns and closed 0.2% higher. The small-cap Russell 2000 gained 0.2%, but the S&P Midcap 400 showed relative weakness by losing 0.2%. Each of the major indices settled in the upper third of their intraday ranges, though the session was a bit choppy overall.
Total volume in the NYSE increased by 18%, while volume in the Nasdaq came in 8% above the previous day's level. Given that most of the major indices closed higher, it's positive that higher volume accompanied the gains. However, turnover in both exchanges remained below 50-day average levels. Recall that NYSE trade fell 40% on Monday. Market internals were mixed. Advancing volume in the NYSE exceeded declining volume by a margin of just under 3 to 2. In the Nasdaq, declining volume beat advancing volume by about the same ratio.
Most industry sectors closed higher yesterday, but there was a lack of standout performances. The Internet Index ($GIN) was the only major sector to gain more than 1%. The Semiconductor Index ($SOX) led the downside with a 0.5% loss. Until yesterday, the $SOX was beginning to show solid relative strength, but a profit warning from Microchip Technology (MCHP) weighed on the sector. Nevertheless, the Semiconductor HOLDR (SMH) held up pretty well because MCHP is not one of its underlying stocks. As SMH continues to form a "bull flag" chart pattern, it is setting up nicely for a long entry in the coming week. The U.S. Oil Fund (USO), which we analyzed yesterday morning, briefly rallied above Monday's high, but came back down just as quickly. It held support of its 200-day moving average for the second day and may soon provide us with a solid long entry on the breakout, particularly if it consolidates near its current price for another 1 to 3 days.
Yesterday's market action did not change the technical picture of the major indices. In yesterday's Wagner Daily, we illustrated and explained that both the S&P 500 and Dow Jones Industrials had support of their 20-day exponential moving averages below, with resistance of their all-time highs just a few points above. The relatively narrow trading ranges in the S&P and Dow prevented the indexes from testing either support or resistance yesterday, so those are the same levels to watch going into today.
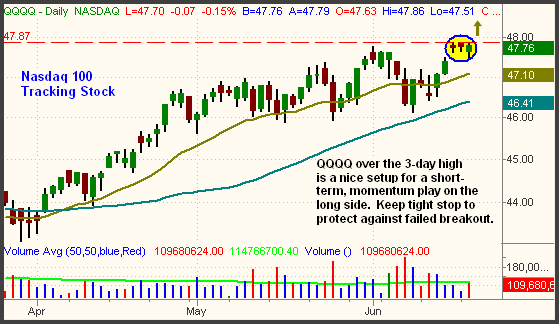
Both the Nasdaq Composite and Nasdaq 100 indices held their new-high territories, while consolidating just below their highs of previous two days. Given the relative strength of the Nasdaq brothers over the S&P, Dow, and even the Russell 2000, four-letter ticker symbols are probably your best bet for new long entries. In addition to SMH, the Nasdaq 100 Tracking Stock (QQQQ) is also setting up for long entry. We're stalking it for a short-term, momentum buy over its three-day high. This would represent a breakout to a fresh six-year high, but a tight stop is recommended in order to protect against a failed breakout:

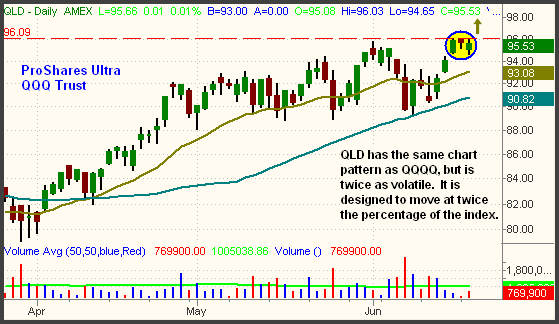
If trading in QQQQ, note that the ProShares Ultra QQQ (QLD) offers the same price action and chart pattern as QQQQ, but is leveraged at 2 to 1. This means that if the Nasdaq 100 Index rallies 0.5%, QLD will gain approximately 1.0%. QQQQ, of course, would gain just 0.5%. Obviously, the leverage can work against you just the same. As you can see below, the daily chart of QLD looks the same as QQQQ, but QLD is more volatile. It is also double the price of QQQQ, so the end result is about the same:

The broad market's narrow-range consolidation of the past three days is bullish, as it is enabling stocks to correct by time, rather than price. The longer the major indices trade in a tight, sideways range near their highs, the more powerful the eventual breakouts should be. Given that stocks have retained last week's gains, overall sentiment has reverted to being moderately bullish. Only a breakdown below the 20-day EMAs of the S&P, Dow, or Nasdaq again would change that.
Deron Wagner is the Founder and Head Trader of both Morpheus Capital LP, a U.S. hedge fund, and Morpheus Trading Group, a trader education firm launched in 2001 that provides daily technical analysis of the leading ETFs and stocks. For a free trial to the full version of The Wagner Daily or to learn about Wagner's other services, visit MorpheusTrading.com or send an e-mail to deron@morpheustrading.com.
|