| The Wagner Daily ETF Report for June 19 |
| By Deron Wagner |
Published
06/19/2007
|
Stocks
|
Unrated
|
|
|
|
The Wagner Daily ETF Report for June 19
The major stock market indexes lethargically moved in a narrow, horizontal range throughout yesterday before finishing flat to modestly lower. The Nasdaq Composite was unchanged in the quiet session, the S&P 500 slipped 0.1%, and the Dow Jones Industrial Average declined 0.2%. Both the small-cap Russell 2000 and S&P Midcap 400 indices lost 0.2%. The S&P and Dow both settled just below their previous day's lows, but the Nasdaq continued to show a bit of relative strength by closing near the middle of the prior session's range.
Turnover fell sharply across the board. Total volume in the NYSE dipped 40% below the previous day's level, while volume in the Nasdaq receded 30%. Granted, the "quadruple witching" expiration of options inflated volume levels the previous day. Yet, it was still the lightest volume day in the NYSE of the past three weeks. In both exchanges, declining volume marginally exceeded advancing volume.
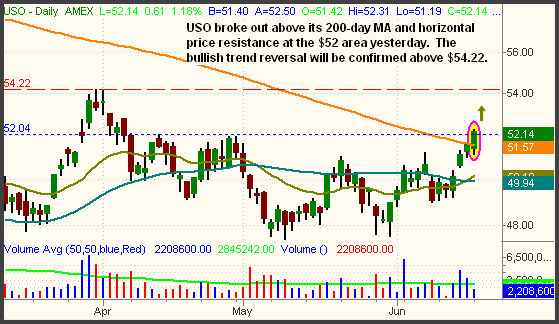
The Oil ($XOI) and Oil Service ($OSX) indexes outperformed the broad market by posting their fourth straight day of gains, closing higher by 0.3% and 0.4% respectively. Semiconductors ($SOX) and Internets ($GIN) were the only other major industry sectors to advance yesterday. Although it has lagged the recent gains of the oil and oil service stocks, the U.S. Oil Fund (USO) is now poised to surge higher as well. USO, which is comprised of a variety of crude oil futures contracts, broke out above horizontal price resistance and closed above its 200-day moving average for the first time since last year's correction began. Based on these two factors, it appears a significant upward trend reversal has begun to take place in USO:

As you can see, USO closed above its first level of horizontal price resistance near the $52 level. This correlated to a break above the 200-day moving average as well. While this is certainly bullish, resistance of the prior high still remains just over the $54 level. Confirmation of the bullish trend reversal would occur when USO firmly closes above that level. Buying partial share size here, then adding when USO rallies above the $54.20 level, is one possible way to play this setup.
When trading USO, note that it only loosely follows the actual price of the crude oil commodity. In order to supposedly reduce risk, USO is always invested in a mix of short, medium, and long-term crude oil futures contracts. In recent times, this has caused USO to show slight relative weakness to the actual Crude Oil Continuous Contract. The iPath Goldman Sachs Crude Oil Index (OIL) and the PowerShares Dynamic Oil Fund (DBO) are two similar alternative ETFs, but USO is definitely the most popular (and highest volume) of the three.
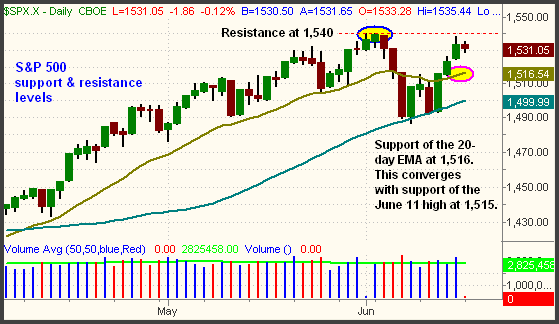
If the S&P 500 pulls back further today, expect the first area of support to be found near the 20-day exponential moving average. Currently, that stands at 1,516, which also converges with support of the June 11 high (formerly resistance). If the index would happen to break that level, the 50-day moving average is standing guard at 1,500. Obviously, the 50-day MA certainly "did its thing" at providing support the last time. Resistance is found for the next 9 points, up through the June 4 high of 1,540:

The Dow has a similar daily chart pattern to the S&P. Its 20-day EMA should provide support at the 13,479 area, while the 50-day MA is at 13,243. Resistance of the prior high is at 13,692, about 80 points above yesterday's close. Consider setting price alerts for all these levels so that you are instantly notified of technical levels that may trigger volatility in the Dow (and S&P). Until the indexes touch either these support or resistance levels, trading is likely to remain quiet. As for the Nasdaq, it's still at a new six-year high. A break of yesterday's low, however, will put the index in danger of a false breakout.
Deron Wagner is the Founder and Head Trader of both Morpheus Capital LP, a U.S. hedge fund, and Morpheus Trading Group, a trader education firm launched in 2001 that provides daily technical analysis of the leading ETFs and stocks. For a free trial to the full version of The Wagner Daily or to learn about Wagner's other services, visit MorpheusTrading.com or send an e-mail to deron@morpheustrading.com.
|