|
The Wagner Daily ETF Report for June 14
The S&P 500 bounced off pivotal support of its 50-day moving average for the second time in a week yesterday, although volume again failed to kick in. Stocks gapped higher on the open, traded sideways throughout most of the session, then zoomed higher upon the 2:00 pm EDT release of the Federal Reserve beige book of economic activity. The S&P 500 led the way with a 1.5% gain, the Dow Jones Industrial Average advanced 1.4%, and both the Nasdaq Composite and small-cap Russell 2000 indices rallied 1.3%. The S&P Midcap 400 was higher by 1.1%. Opposite of Wednesday's action, all the major indices finished at their best levels of the day. Yesterday's session was largely driven by news, as a majority of the stock market's gains were realized after the late-day Fed news. As with FOMC interest rate announcements, the initial knee-jerk reactions to intraday economic news events are sometimes short-lived, so we will probably see the real reaction today.
Like the June 8 rally off the 50-day moving averages, lower turnover prevented the major indices from registering a bullish "accumulation day." Total volume in the Nasdaq receded by 5%, while volume in the NYSE came in 1% below the previous day's level. To the market's credit, volume tapered off to a lesser degree than it did on June 8. Nevertheless, both exchanges lacked the higher volume punch that would have confirmed the return of institutional buying activity. Market internals were solid. Advancing volume in the NYSE exceeded declining volume by a margin of just below 7 to 1. The Nasdaq ratio was positive by nearly 7 to 2.
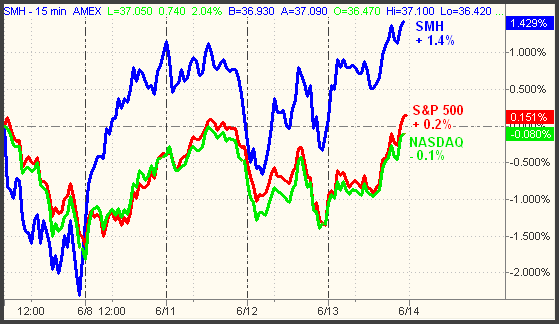
The Semiconductor HOLDR (SMH), which we have been stalking for a long entry over the past several days, broke out above resistance of its intermediate-term downtrend line. It also triggered our long entry at 36.81, just above the June 12 high. SMH has been choppy over the past two weeks, but has nevertheless been showing relative strength to both the S&P and Nasdaq. When stocks began to bounce off their lows on June 8, SMH began rallying a greater percentage than the broad market. As the major indices dropped on June 12, SMH fell a lesser percentage than the major indices. This relative strength can be easily seen on the 5-day "percentage change" chart below:

Since June 6, SMH has gained 1.4%. During that same period, the S&P 500 has gained only 0.2%. The Nasdaq has lost 0.1%. The chart above is a good example of how stocks and ETFs with relative strength are the last to fall when the general market does, and the first to surge higher when the market eventually does. In markets that are correcting to the downside, it's important to ensure that all buy entries are showing relative strength to the major indices. Conversely, only sectors with relative weakness should be sold short in strong markets. We are constantly scanning for relative strength and weakness in the ETF trade setups we provide each day.
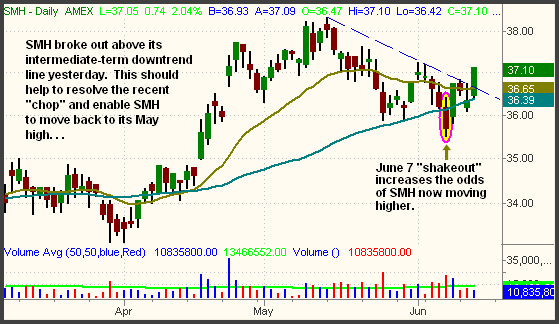
Yesterday's breakout above its daily downtrend line should enable SMH to begin trending back to its 52-week high, while the 50-day MA below should now provide support on a pullback. The "shakeout" on June 7 (circled in pink on the chart below) increases the odds of upside follow-through now that the downtrend line has been broken:

In yesterday's commentary, we said that, "all eyes will be focused on whether or not the S&P 500 closes above its 50-day MA today." Clearly, they were, as the 50-day MA once again "did its thing" to trigger another bounce. This time, the S&P also managed to close above resistance of its 20-day EMA. However, the index also finished right at resistance of the June 11 high. This is illustrated on the daily chart below:

Although not shown above, the S&P 500 has retraced just over 50% of its loss from the June 4 high, down to the June 8 low. If the index clears the June 11 high, resistance will next be found at the 61.8% Fibonacci retracement of the 1,520 level. If the S&P manages to close above that level within the next day or two, it could begin to work its way back to the prior high sooner, rather than later. Like the S&P 500, the Dow Jones also closed at resistance of its June 11 high. The 61.8% Fibonacci retracement for the Dow is at 13,522, 40 points above yesterday's close.
Just one glance at the intraday charts of the past week immediately shows how erratic the market has been. We warned of potential choppiness when the S&P first touched its 50-day MA, and it certainly hasn't disappointed in that regard! Part of the indecisiveness has been occurring because many of the major indices are trapped between support of their 50-day MAs and resistance of their 20-day MAs. Compounding the issue is tomorrow's "quadruple witching" options expiration day. On the third Friday of the last month of each calendar quarter, volatility typically picks up because of this. Unfortunately, we can expect more choppiness and erratic behavior until this week is finished. Perhaps next week, stocks will more clearly show their hand as to which direction they will go as we enter the summer.
Deron Wagner is the Founder and Head Trader of both Morpheus Capital LP, a U.S. hedge fund, and Morpheus Trading Group, a trader education firm launched in 2001 that provides daily technical analysis of the leading ETFs and stocks. For a free trial to the full version of The Wagner Daily or to learn about Wagner's other services, visit MorpheusTrading.com or send an e-mail to deron@morpheustrading.com.
|