|
The Wagner Daily ETF Report for May 30
Stocks kicked off the holiday-shortened week with an indecisive session that eventually settled modestly higher. The S&P 500 rose above last Friday's high in the morning, reversed into negative territory just after mid-day, then rallied off its low later in the afternoon. The other broad-based stock market indices followed a similar intraday pattern, though the Nasdaq showed a bit more relative strength. The Nasdaq Composite rallied 0.6%, the S&P 500 advanced 0.2%, and the Dow Jones Industrial Average eked out a gain of 0.1%. The small-cap Russell 2000 and S&P Midcap 400 indices were higher by 0.9% and 0.6% respectively. All the major indices finished slightly above the middle of their intraday ranges, confirming indecision all the way into the close.
Turnover rose above last Friday's light pre-holiday levels, but volume in both exchanges remained well below average. Total volume in the NYSE was 15% higher than the previous day's level, while volume in the Nasdaq increased by 10%. The broad-based gains on higher volume technically caused both the S&P and Nasdaq to register bullish "accumulation days." However, it's misleading to label the session as one of institutional buying considering that volume in both the NYSE and Nasdaq came in significantly below the 50-day average levels. Market internals were also not that impressive. Advancing volume in the Nasdaq rivaled declining volume by a margin of 2 to 1, but the NYSE ratio was positive by only 1.3 to 1.
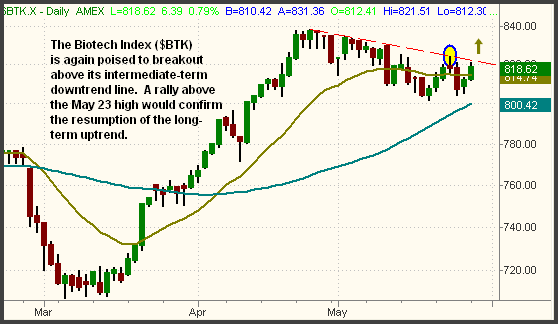
In the May 23 issue of The Wagner Daily, we illustrated how the Biotech Index ($BTK) was beginning to show relative strength and setting up for a resumption of its primary uptrend. We still feel that is the case, as the index dipped back below its 20-day EMA on May 24, but quickly snapped back above it yesterday. The ability of it to recover from such a shakeout tells us that a short to intermediate-term bottom may be put in. As you can see on the daily chart, the $BTK will break out above its five-week downtrend line if it closes above yesterday's high. An even safer entry that provides more price confirmation is over the May 23 high of 824:

As we mentioned last week, the Biotech HOLDR (BBH) should be avoided because of its relative weakness. Instead, consider the First Trust Biotech (FBT), which has a chart pattern that more closely mirrors the actual $BTK Index. Regular subscribers should note our trigger, target, and stop prices for the FBT setup below. The StreetTRACKS Biotech SPDR (XBI) is also one of the better looking ETFs in the sector.
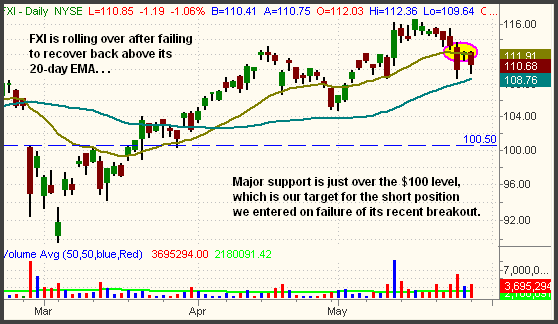
As of the middle of China's trading session, around midnight EDT, the Shanghai Index is trading more than 6% lower. Given the strong gains the index has recently racked up, it's not a disaster, but the performance in the final half of the session is yet to be seen. As you might recall, we sold short the iShares Xinhua China 25 Index (FXI) on May 25 because it failed its mid-May breakout, then broke support of its daily uptrend line and 20-day EMA on May 24. So far, our short entry is working out well. We liked the entry on May 25 because the bounce into resistance of its 20-day EMA provided us with a positive risk/reward ratio for the setup. After failing to move back above its 20-day EMA, FXI subsequently sold-off yesterday. We've circled new resistance of the 20-day EMA on the daily chart below:

Today, the big question is whether or not FXI will hold above its 50-day MA. Given the overnight action in China, it's likely FXI will firmly gap down below it. If it does, overhead supply from the recent failed breakout should add to the selling pressure. Below its 50-day MA, next support is the May 1 low, around $105. If that level fails to hold, the bottom of the gap from February 27 should provide greater support, around the $100 level. We're presently showing an unrealized gain of 1.2 points on the FXI short position, with a downside price target of another 10 points ($100.30). For your information, the PowerShares Golden Dragon China Index (PGJ) is a less expensive alternative, though its underlying stocks are not the same as those of FXI.
As for the broad market, keep an eye on whether or not the S&P 500 holds above its 20-day EMA. It bounced off its support on May 25, then tacked on an additional modest gain yesterday, but still has recovered only half of the range from its May 24 loss. More importantly, the recovery attempt has occurred on very feeble volume. Nevertheless, the S&P could certainly continue to hold above its 20-day EMA, just as it has done for the past several months. If it does, we will buy relatively strong sectors such as Biotech and others. It really doesn't matter to us whether the S&P holds and resumes its uptrend, or enters into a short to intermediate-term correction from here. We're prepared either way, and we wish our subscribers to be as well.
Deron Wagner is the Founder and Head Trader of both Morpheus Capital LP, a U.S. hedge fund, and Morpheus Trading Group, a trader education firm launched in 2001 that provides daily technical analysis of the leading ETFs and stocks. For a free trial to the full version of The Wagner Daily or to learn about Wagner's other services, visit MorpheusTrading.com or send an e-mail to deron@morpheustrading.com.
|