| The Wagner Daily ETF Report for May 24 |
| By Deron Wagner |
Published
05/24/2007
|
Stocks
|
Unrated
|
|
|
|
The Wagner Daily ETF Report for May 24
After gapping higher on the open, stocks oscillated in a narrow range throughout the first half of the session, but the bears sent the stock market into negative territory later in the afternoon. Despite the relative strength both indexes have recently displayed, the Nasdaq Composite and small-cap Russell 2000 each slid 0.4%. The S&P 500 and Dow Jones Industrial Average were both lower by 0.1%. The S&P Midcap 400 Index lost 0.3%. Though the losses were small, the morning intraday gains the major indices sacrificed pointed to more negative action than might be assumed from merely glancing at the closing numbers. Worse is that most of the stock market indexes finished at their intraday lows. The Dow Jones Industrial Average was the exception, closing in the bottom 20% of its range.
Turnover picked up across the board, causing both the S&P and Nasdaq to register bearish "distribution days" that were indicative of institutional selling. Total volume in the NYSE increased by 10%, while volume in the Nasdaq came in 5% higher than the previous day's level. Normally, a closing loss of just 0.1% would not be substantial enough for the S&P to be labeled as a "distribution day." But considering that the index gave up an earlier intraday gain of 0.5%, it's safe to say that institutions were selling into strength. Declining volume in the Nasdaq exceeded advancing volume by a margin of approximately 3 to 2. The NYSE volume spread was flat.
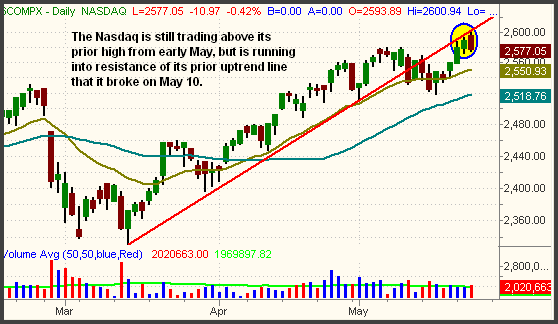
Although it led the S&P and Dow in the preceding three sessions, the Nasdaq's performance yesterday was disappointing. Upon close analysis, one technical reason for the weakness was that the index had rallied into resistance of its prior uptrend line on the daily chart. Remember, the most basic tenet of technical analysis states that a prior support level becomes the new resistance level after the support is broken. As such, the primary uptrend line that the Nasdaq fell below on May 10 is now acting as resistance. This trendline is illustrated on the daily chart below:

It's intraday pattern was bearish, but the Nasdaq still closed above its prior highs from early May. If it manages to hold this level, it would be a sign of resilience for the index. Conversely, a sell-off back down to its 20-day exponential moving average would be bearish and represent a failed breakout at the new high.
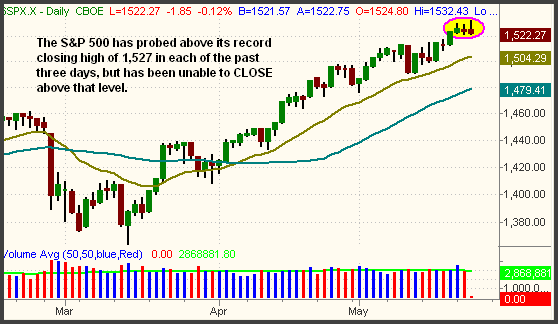
The most concerning thing about the action in the S&P 500 is its inability to close above the closely-watched level of 1,527, the all-time closing high in the index. In each of the past three sessions, the S&P has probed above the 1,527 level on an intraday basis, but has been unable to finish above it. Clearly, traders have been selling into strength near this pivotal level. The index has also formed bearish "inverted hammer" candlesticks in each of the past three days:

If it fails to hold yesterday's low, the almighty Dow will also be poised for a price correction. It settled at support of its 40-MA on the hourly chart yesterday. In recent weeks, this level has acted as support that enabled the Dow to resume its steady uptrend. However, a firm close below yesterday's low would break support of the secondary uptrend line, which in turn could translate to a short-term correction in the Dow. The Dow has proven wrong anyone who has anticipated a correction throughout the past six weeks. The difference this time is that the index has begun to show relative weakness, as money began flowing out of large caps and into small caps last Friday.
Initially, we viewed the rotation into small-caps and the Nasdaq as a positive sign that could help sustain the market's strength. We correspondingly bought both the Semiconductor HOLDR (SMH) and iShares Russell 2000 (IWM) as a result. Unfortunately, the rotation may have come too late in the cycle of the rallies in the S&P and Dow. Both SMH and IWM initially showed relative strength, but fell under selling pressure yesterday. We stopped out of SMH. We remain long IWM, although our stop has been trailed tighter in order to substantially reduce our risk.
Deron Wagner is the Founder and Head Trader of both Morpheus Capital LP, a U.S. hedge fund, and Morpheus Trading Group, a trader education firm launched in 2001 that provides daily technical analysis of the leading ETFs and stocks. For a free trial to the full version of The Wagner Daily or to learn about Wagner's other services, visit MorpheusTrading.com or send an e-mail to deron@morpheustrading.com.
|