|
The Wagner Daily ETF Report for April 18
The blue-chip Dow index followed-up the previous day's strength with a decent gain of 0.4%, but action in the rest of the stock market was mixed. The S&P 500 closed 0.2% higher, but the Nasdaq slipped 0.1%. The small-cap Russell 2000 and S&P Midcap 400 typically lead the broad market on the "up" days, but both indices showed notable relative weakness by losing 0.3% and 0.1% respectively. With the exception of the Dow, which closed in the upper 20% of its intraday range, all the major indices finished near the middle of their ranges. Considering that the S&P, Nasdaq, and Dow each closed at their highs in the preceding three sessions, a bit of indecision yesterday was not surprising.
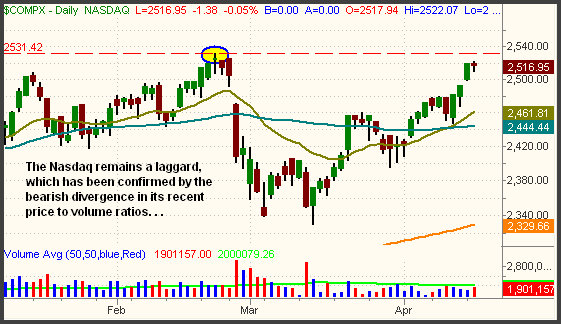
Volume ticked higher in both exchanges, which yielded mixed implications for the market. Total volume in the NYSE edged 1% higher, enabling the S&P 500 to score its second consecutive day of gains on increasing turnover. However, volume in the Nasdaq was 9% greater than the previous day's level. Though its 0.1% loss on higher volume was not enough to label the session a "distribution day," the price to volume relationship of the index has nevertheless remained bearish in the short-term. The Nasdaq has had three days of gains and two days of losses within the past five sessions, but all three of the winning days were on declining volume, while both of the losing days were on higher volume. This, unfortunately, is the opposite price to volume relationship you want to see in a healthy market because it indicates a clear lack of institutional buying support. As for yesterday's market internals, advancing volume was roughly on par with declining volume in both exchanges.
Over the past several days, we have highlighted specific sector ETFs with bullish chart patterns to watch for potential long entry when the market pulls back. The list has included the following: Pharmaceutical HOLDR (PPH), iShares Software (IGV), First Trust IPOs (FPX), and the Market Vectors Gold Miners (GDX). All but GDX confirmed their recent relative strength by adding slightly to their gains yesterday. As such, we continue stalking them for ideal entry points either on retracements to near support of their breakout levels, or after a bit of price consolidation. GDX retraced 1.4% alongside of a modest correction in the price of spot gold, but this pullback to near support of its hourly uptrend line may provide a low-risk entry for an initial, partial position.
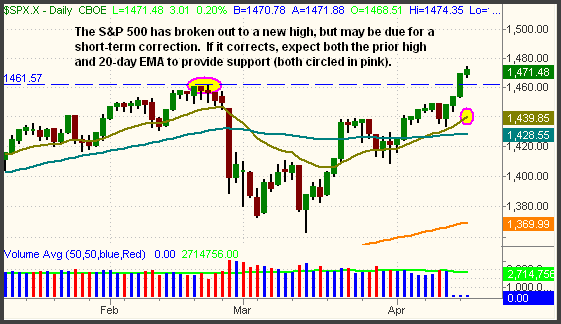
We haven't analyzed support and resistance levels of the broad market since last week, so let's take an updated look. We'll begin with the benchmark S&P 500:

The first thing to notice about the S&P 500 is that it has cleared resistance of its February highs and is trading at a fresh multi-year high. So far, it is the only one of the "big three" stock market indexes that has rallied to a new high. Based on how far it has pulled away from its 20-day exponential moving average, the index may be on the "overbought" side in the short-term, but remember that "overbought" markets often continue to become more "overbought" before correcting. This is especially true of an index trading at a multi-year high because there is a lack of overhead supply to hold it down. Nevertheless, it will eventually correct. When it does, the first area of support should be found around 1,461, the pivotal level of its recent breakout. A small probe below that level would not be unusual, but the 20-day EMA would catch the S&P if it does. A retracement to the 1,450 to 1,460 range would enable one to enter new long positions with an overall positive risk/reward ratio. If the index holds support at the proper levels, their would be a high chance of entering new long positions near their "swing lows" in order to catch the next wave up. Conversely, if a healthy, orderly correction turns into a high volume sell-off, the entry points are low enough that one can quickly close new positions with minimal losses.
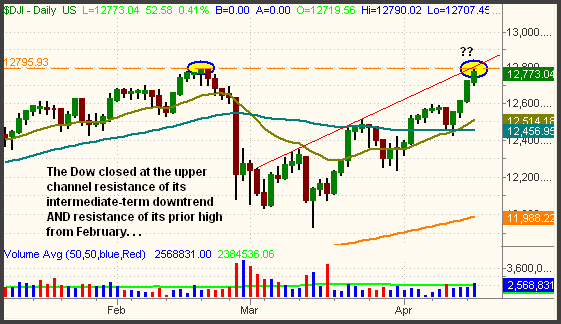
The Dow Jones Industrial Average has fully recovered its loss from the massive February 27 sell-off, and is just shy of moving back to a new all-time high. However, it also closed yesterday at resistance of the upper channel of its uptrend:

Like the S&P, the Dow is just below the upper channel resistance of its intermediate-term uptrend that began with the March lows (the red ascending line). Therefore, it too has good odds of at least a short-term correction. One big difference between the S&P and Dow, however, is that the S&P can fall back on support of its prior highs from February. Since the Dow is still below its February high, a correction from current levels could generate more downside momentum if traders and investors begin to fear a "lower high" formation on the daily chart. The same is true of the Nasdaq Composite, which has been laggard of the three major indices:

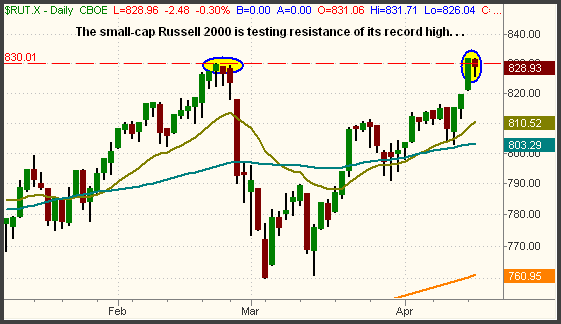
Finally, let's check out the Russell 2000 daily chart because the small-cap benchmark is often a reliable leading indicator of the broad market direction. We would even go as far as to say it has replaced the Semiconductor Index ($SOX), which has gone virtually nowhere for six months, as an accurate barometer of the Nasdaq's health:

Two days ago, the Russell barely managed to close at a new record high, but its relative weakness yesterday immediately caused the index to move back below its prior high. With the Dow and Russell both testing their all-time highs, it's not unreasonable to assume the direction of these indices over the next one to two weeks will have a large bearing on the next intermediate-term direction of the broad market.
Quarterly earnings season is now in full swing, so be cognizant of key players that are reporting from day to day. Unfortunately, technical analysis usually means very little when there is a major shock to the system such as a keystone company either blowing away or completely missing their earnings expectations. After yesterday's close, Internet titan Yahoo! (YHOO) missed their earnings expectations and was trading quite a bit lower in the after-hours market. In sympathy, the Nasdaq after-hours futures were off slightly. Intel and IBM also reported last evening, though the stock market reaction to both reports was relatively muted.
Deron Wagner is the Founder and Head Trader of both Morpheus Capital LP, a U.S. hedge fund, and Morpheus Trading Group, a trader education firm launched in 2001 that provides daily technical analysis of the leading ETFs and stocks. For a free trial to the full version of The Wagner Daily or to learn about Wagner's other services, visit MorpheusTrading.com or send an e-mail to deron@morpheustrading.com.
|