|
The Wagner Daily ETF Report for April 17
Stocks secured a solid round of gains yesterday, as a broad-based rally enabled the S&P 500 to post its highest close since September of 2000. Both the S&P 500 and Nasdaq Composite zoomed 1.1% higher, while the Dow Jones Industrial Average gained 0.9%. The small-cap Russell 2000 advanced 1.5% and the S&P Midcap 400 rallied 1.1%. Most of yesterday's gains were the result of upside opening gaps, but the major indices still finished at their intraday highs for the third straight day.
Higher volume in the NYSE confirmed the S&P's breakout to a fresh multi-year high, but despite its strong gain, turnover in the Nasdaq continued to decline. A 9% rise in the total volume of the NYSE caused the exchange to register a bullish "accumulation day." However, the increase was not enough to push volume back above its 50-day average level. Yesterday was the sixteenth consecutive session of lighter than average volume in the NYSE. In the Nasdaq, total volume was 7% lower than the previous day's level. The Nasdaq has gained in each of the past three days, advancing 2.4% in the process, but each of the three days have occurred on successively lighter volume. As such, one could infer that the Nasdaq's recent gains have been more the result of a scarcity of sellers as opposed to an abundance of buyers. Normal pullbacks in the stock market tend to be more orderly and less severe when stocks are being supported by institutional demand. Conversely, gains that accumulated on steadily declining volume can disappear much more easily during a correction.
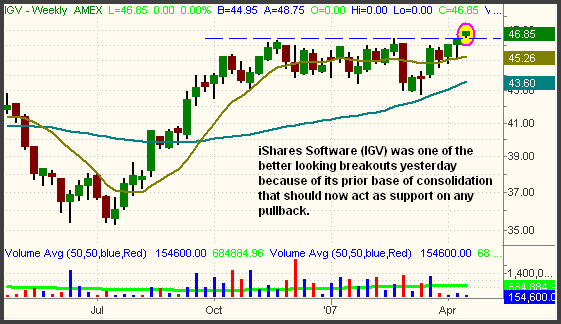
Numerous sectors and ETFs broke out to new highs along with the S&P 500 yesterday, but most of them lacked a significant base of prior consolidation. When a stock or ETF breaks out, the longer the preceding consolidation, the more likely the breakout will hold. This is because a prior base of consolidation subsequently acts as the new support level. Conversely, break outs to new highs that have already been trending steadily higher are more likely to fail when the market pulls back. One ETF, however, that broke out from a multi-month sideways consolidation was the iShares Software Index (IGV). As illustrated on the weekly chart below, IGV was consolidating near its high for about five months before yesterday's breakout:

The horizontal line on the chart above marks the high of the prior consolidation, around the $46.45 level. A retracement to this level would represent a low-risk entry point to buy IGV because it should provide substantial price support. As always, a protective stop should be place just below the pivotal level to protect against a failed breakout.
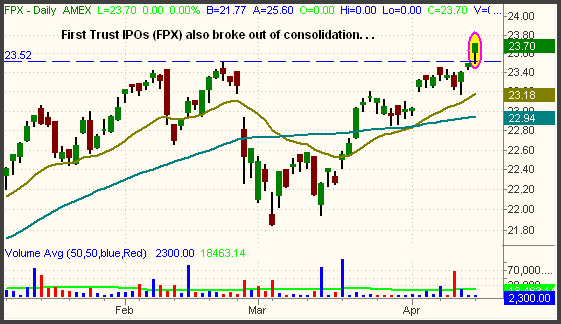
Another ETF that broke out to a new high from a base of consolidation was the First Trust IPO Index (FPX). This unique ETF that tracks an index of initial public offerings (IPOs) dipped below its 50-day MA last month, but quickly recovered. As with IGV, the prior horizontal price resistance should now act as support:

You may notice that FPX has a low average daily volume of only 20,000 shares per day. However, don't let that keep you from trading it. Unlike individual stocks, in which liquidity can greatly affect how a stock trades, remember that all exchange traded funds are synthetic instruments. As such, the amount of average daily volume that an ETF trades is, for the most part, irrelevant. Even if a particular ETF had no buyers or sellers for several hours, the bid and ask prices would continue to move in correlation with the market value of the ETF that is derived from the prices of the underlying stocks. An ETF with a low average daily volume may sometimes have slightly wider spreads between the bid and ask prices, but you can simply use limit orders if this is the case. We trade for points, not pennies, so paying a few cents more on occasion is not a big deal.
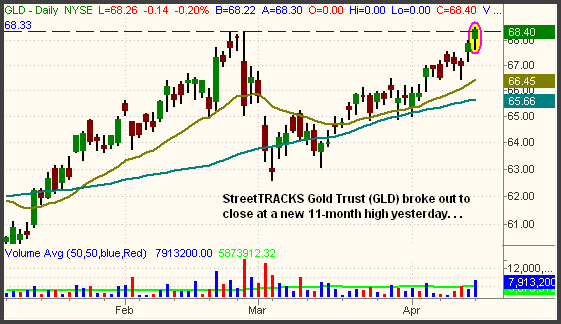
The Market Vectors Gold Miners (GDX), which we pointed out as a breakout candidate in yesterday's newsletter, rallied to a new all-time closing high yesterday. It is still below the intraday price spike of February 23, but that should provide only minimal overhead supply. The StreetTRACKS Gold Trust (GLD), which mirrors the price of the spot gold commodity, finished at an 11-month high and closed above its intraday highs from late February:

Because it closed above resistance of its prior highs, we remain long GLD from our initial entry on March 28. The trade is now showing an unrealized gain of 2.25 points (3.4%), but we will simply continue to trail a stop higher, below the hourly uptrend line, in order to maximize profits.
It's certainly impressive that the S&P 500 has not only recovered all of its losses from the late February sell-off, but has rallied all the way back to a new multi-year high in such a short period of time. Admittedly, we're quite surprised it happened in just a five-week period, but we must respect the bullishness and trade what we see, not what we think. Nevertheless, a one day close at a new high is not enough to unequivocally confirm a breakout. Further, both the Nasdaq and Dow remain below their February highs. Ride out the uptrend as long as it remains in effect, but we humbly suggest you avoid complacency and maintain a degree of caution.
Deron Wagner is the Founder and Head Trader of both Morpheus Capital LP, a U.S. hedge fund, and Morpheus Trading Group, a trader education firm launched in 2001 that provides daily technical analysis of the leading ETFs and stocks. For a free trial to the full version of The Wagner Daily or to learn about Wagner's other services, visit MorpheusTrading.com or send an e-mail to deron@morpheustrading.com.
|