| The Wagner Daily ETF Report for April 11 |
| By Deron Wagner |
Published
04/11/2007
|
Stocks
|
Unrated
|
|
|
|
The Wagner Daily ETF Report for April 11
Like the previous day, the major indices drifted sideways, in a tight range, throughout most of the day, but this time a late day bump enabled stocks to finish modestly higher. The S&P 500, Nasdaq Composite, S&P Midcap 400, and small-cap Russell 2000 indices each registered identical gains of 0.3%. The Dow Jones Industrial Average lagged behind by advancing less than 0.1%. Still, it was enough for the index to post its eighth straight day of higher closing prices. The S&P 500 and Nasdaq Composite both closed near their intraday highs. However, the intraday range of the S&P 500 was again limited to only five points. The Dow finished just above the middle of the day's range.
Total volume in the NYSE was 5% higher than the previous day's level, while volume in the Nasdaq similarly increased by 4%. The broad-based gains on higher volume pointed to a bit of institutional accumulation in both the S&P and Nasdaq, though the rally lacked overall power. If not for the Nasdaq's advance in the last thirty minutes of trading, the index would have closed flat and flashed another session of bearish "churning." Market internals were mildly positive. Advancing volume in the NYSE exceeded declining volume by a ratio of just over 3 to 2. The Nasdaq volume spread was positive by a slightly lesser margin.
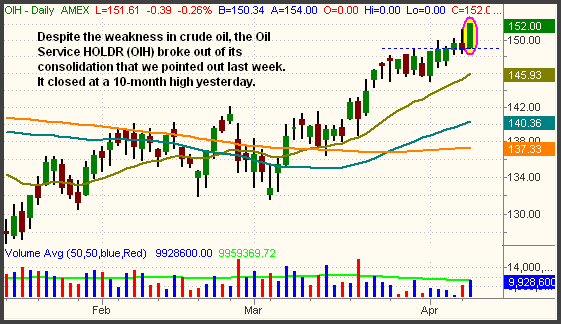
Over the past week, there has been a curious divergence between the price of the crude oil commodity and stocks in the oil service sector. On April 5, we bought the U.S. Oil Fund (USO) as it gapped higher after testing support of its breakout level from the prior week. Although we really liked the setup at the time of entry, crude oil sold off sharply the next day, causing USO to break support and quickly stop us out. The failed breakout in USO was disappointing, but it's an occasional part of the business. What we found most interesting, however, is that the various Energy ETFs have completely ignored the weakness in crude oil. The Oil Service HOLDR (OIH), for example, rallied 2.1% yesterday and closed at a 10-month high. Throughout last week, we discussed the bullish consolidation in OIH and targeted the ETF for a potential breakout. The rally to a new high happened as anticipated, but we really didn't expect the breakout to still occur after crude oil (and USO) failed last week's breakout:

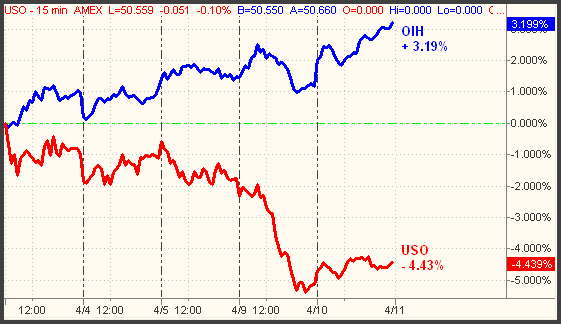
The major price divergence between OIH and USO is illustrated below. This chart shows the percentage price changes of both ETFs over the past five days. OIH is the blue line and USO is the red line. Overlay charts like this are a great way to compare the relative strength of several ETFs within the same sector:

Unfortunately, the bearish divergence in USO was not apparent four days ago, or else we would have bought OIH instead. On the contrary, USO was actually showing significant relative strength to OIH prior to April 3. This was one of the reasons we bought USO, but the bullish divergence flipped around only a few days later. We had the right idea to be long the energy sector, but the wrong ETF. "Percentage change" charts like the one above can normally prevent you from picking the wrong ETF in a sector. However, there's not much you can do when the price divergence reverses after you have already entered the position.
Not a whole lot has changed in the technical picture of the market. The short-term trends remain moderately bullish, although the power of institutional buying has been lacking. Overhead supply from late February means we're not out of the woods yet. If stocks consolidate here for aa few weeks, that would really enable the market to build a base of support from which to break out to new highs. However, a steep retracement could change the market's sentiment rather quickly. Most likely, the direction of the market from here will all come down to the market's reaction to the plethora of earnings reports on tap over the next several weeks. Alcoa, which reported after yesterday's close, was the first major company to announce their quarterly results. Let's see how the market reacts to this and others over the next few days before placing too much new money into action.
Deron Wagner is the Founder and Head Trader of both Morpheus Capital LP, a U.S. hedge fund, and Morpheus Trading Group, a trader education firm launched in 2001 that provides daily technical analysis of the leading ETFs and stocks. For a free trial to the full version of The Wagner Daily or to learn about Wagner's other services, visit MorpheusTrading.com or send an e-mail to deron@morpheustrading.com.
|