| The Wagner Daily ETF Report for March 27 |
| By Deron Wagner |
Published
03/27/2007
|
Stocks
|
Unrated
|
|
|
|
The Wagner Daily ETF Report for March 27
The broad market dropped sharply after yesterday's opening bell, but found support only an hour later. The stock market indexes subsequently grinded their way back throughout the afternoon and eventually finished near unchanged levels for the third straight day. The S&P 500 and Nasdaq Composite gained 0.1% and 0.3% respectively. The Dow Jones Industrial Average lost 0.1%, but that's not bad considering it was off by 0.9% at its intraday low. Both the small-cap Russell 2000 and S&P Midcap 400 indices also closed 0.1% lower. Each of the major indices finished near their best levels of the session, but in the middle of their respective trading ranges of the prior two days.
Total volume in the NYSE increased by 5%, while volume in the Nasdaq was 7% above the previous day's level. The Nasdaq's bullish reversal and higher volume gain registered an institutional "accumulation day" in that exchange, but the mixed results in the S&P and Dow did not confirm. Moreover, a closer look at yesterday's activity actually reveals a bearish pattern of higher turnover during the sell-off than on the recovery back up. At 10:30 am EDT, when stocks were at their intraday lows, volume in the NYSE was on pace to be 11% higher. However, volume declined as stocks subsequently rallied back to their morning highs, as indicated by the final volume level being only 5% above the previous day. Volume in the Nasdaq similarly receded from being 12% higher during the sell-off to only 7% higher by day's end. On days when the market has two opposing trends between the morning and afternoon, an intraday analysis of volume changes is helpful at determining whether the bulls or bears truly had the upper hand.
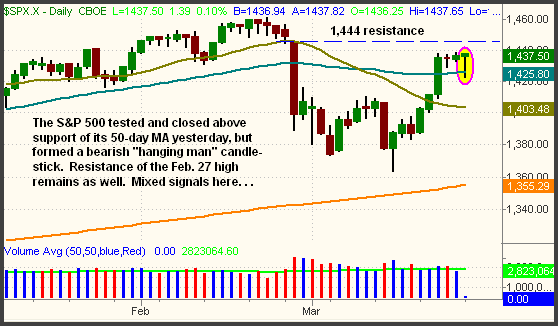
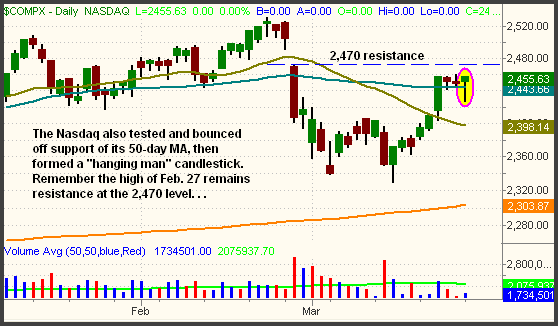
One key factor that likely prompted the bullish afternoon reversal was the probe below the 50-day moving averages of both the S&P 500 and Nasdaq Composite. Both indices dipped below their 50-day MAs, triggering many stop orders in the process, but recovered to close above that pivotal support level. While it's bullish that the S&P and Nasdaq indices quickly reversed higher after testing support of their 50-day MAs, yesterday's action was indicative of a market that is not too sure of itself. The intraday price action also caused bearish "hanging man" candlestick patterns to form on the daily charts of the major indices. A "hanging man" looks just like a bullish "hammer" candlestick pattern, but the preceding price action makes the difference. A "hanging man" occurs after a rally and is a sign that the bulls may be getting tired. Conversely, a "hammer" occurs after a sell-off and is a sign that the bulls may be regaining control. We have circled the "hanging man" candlesticks on the charts of the S&P and Nasdaq below. We have also illustrated the continuing resistance of their February 27 highs (due to the gap):


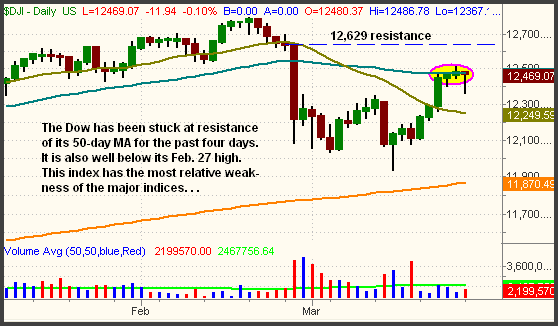
Obviously, aggressive short selling action should not be taken based solely on the formation of "hanging man" candlesticks, but the pattern should serve as a warning to astute traders. Often, this pattern precedes a significant sell-off only a few days later, but the current market is also showing bullish mixed signals. Until the S&P and Nasdaq actually close below their 50-day MAs, we cannot assume much in the way of a short-term pullback. The Dow's inability to get back above its 50-day MA, however, remains the one problem area that could hold the market down:

Yesterday morning's sell-off has enabled many stocks and indexes to form new anchor points for their short-term hourly uptrend lines. We can assume the short-term uptrend remains intact as long as the stock or index in question remains above its hourly uptrend line (using yesterday's low as a new anchor). But if we begin to see breakdowns below these uptrend lines, and especially below yesterday's lows, the broad market's bounce off the March 14 lows may be over. The intermediate-term trends remain "down," but the short-term are "up" unless we see violations of yesterday's lows. Keep that as a focal point in your trading decisions this week and it should keep you out of trouble.
Deron Wagner is the Founder and Head Trader of both Morpheus Capital LP, a U.S. hedge fund, and Morpheus Trading Group, a trader education firm launched in 2001 that provides daily technical analysis of the leading ETFs and stocks. For a free trial to the full version of The Wagner Daily or to learn about Wagner's other services, visit MorpheusTrading.com or send an e-mail to deron@morpheustrading.com.
|