| The Wagner Daily ETF Report for March 16 |
| By Deron Wagner |
Published
03/16/2007
|
Stocks
|
Unrated
|
|
|
|
The Wagner Daily ETF Report for March 16
Stocks traded in an uneventful, sideways range throughout yesterday's session before finishing the day modestly higher. The S&P 500 gained 0.4%, the Nasdaq Composite 0.3%, and the Dow Jones Industrial Average 0.2%. Small and mid-cap stocks outperformed, enabling the Russell 2000 and S&P Midcap 400 indices to rally 1.0% and 0.7% respectively. A bounce in the final fifteen minutes of trading caused the Russell to close at its intraday high, but all the other indices settled just above the middle of their intraday ranges.
Though the major indices built on their gains from the previous day's reversal, significantly lighter volume indicated a lack of institutional buying interest. Total volume in the NYSE declined by 28%, while volume in the Nasdaq was 22% lower than the previous day's level. In both exchanges, turnover fell below 50-day average levels. The 1.8 billion shares that exchanged hands in the Nasdaq was the second lightest day of the year. Higher volume would have indicated a growing appetite for stocks by mutual funds, hedge funds, and other institutions, but they remained on the sidelines instead. The S&P has had seven "up" days since its February 22 peak, but only one of those sessions occurred on higher volume. Until we begin to see clear signs of institutional accumulation, as determined by studying the market's daily price to volume ratio, buying stocks remains a risky proposition.
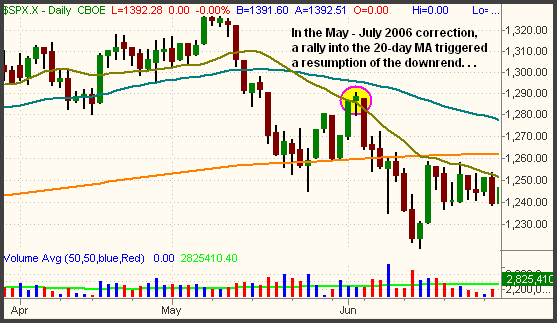
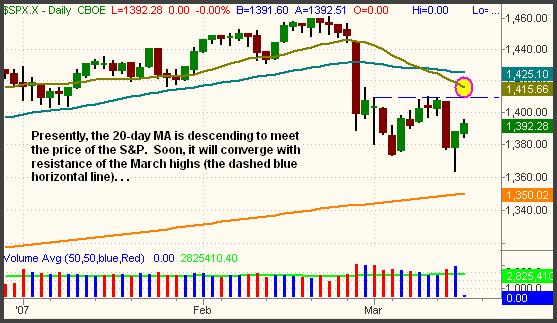
Yesterday, we compared a few similarities of the May - July 2006 correction with the broad market's current correction. If the market continues to unfold in a similar fashion, we should soon expect the 20-day moving averages of the S&P, Nasdaq, and Dow to act as resistance to push these indices back down to test their lows. Below are two daily charts of the S&P 500. The first one highlights how a rally into the 20-day MA in early June triggered a resumption of the downtrend that began the previous month. The second chart is a current snapshot that shows how the 20-day MA is quickly approaching the price of the S&P:
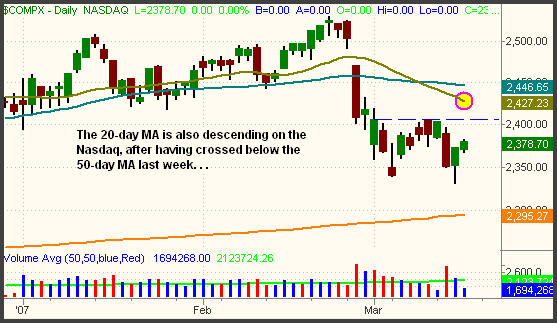
Like the S&P, the Nasdaq also resumed its downtrend after running into its 20-day MA last June. This eventually led to two more "lower lows" over the next two months. Below is a chart of the Nasdaq from last May - July, followed by a current snapshot of the index:
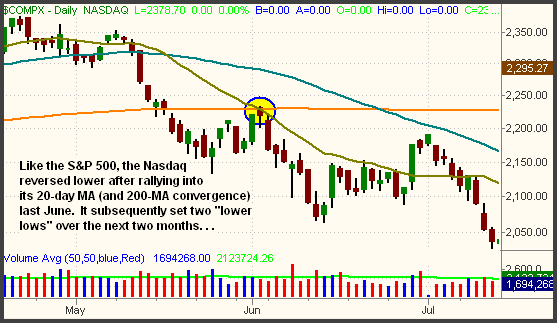
When a market has reversed its intermediate-term trend, we like to watch for confirmation of the 20-day moving average to cross below the 50-day MA. Looking at the charts above, you will see this occurred quickly in last year's correction, and has done the same this time as well. After their 20-day MAs initially crossed below their 50-day MAs last May, it took the S&P 500 twelve days and the Nasdaq eight days to rally back into their respective 20-day MAs. A subsequent test of the 50-day MAs did not come until July, near the end of their downtrends. The correction that began in May of 2006 lasted for three months, a typical period of a "healthy" correction. As mentioned before, it usually takes at least one to two months for the market to recover from a sharp sell-off like the one experienced on February 27.
Although the descending 20-day moving averages are soon likely to trigger another selling spree, we don't know whether the major indices will rally up to their 20-day MAs or if they will simply "correct by time" and trade sideways until the 20-day MAs descend further. There is also the possibility, of course, that stocks will move back down to test their lows before the 20-day MAs converge with the prices of the S&P, Nasdaq, and Dow. Considering that the broad market attempted to build a short-term bottom with the March 14 reversal, a rapid move back down to that day's intraday low would be rather bearish.
Remember that today is "triple witching" options expiration day. Once per quarter, the institutional manipulation of stocks to move closer to their "strike prices" typically results in increased volatility, higher volume, and erratic intraday price action. If it's not enough fun that the major indices are stuck in the middle of this week's trading ranges, we can look forward to the probability of whippy price action to close the week. Buckle up and ride out the volatility because there is a good chance we will see resumption of the intermediate-term downtrend next week. But as always, obey your protective stops.
Deron Wagner is the Founder and Head Trader of both Morpheus Capital LP, a U.S. hedge fund, and Morpheus Trading Group, a trader education firm launched in 2001 that provides daily technical analysis of the leading ETFs and stocks. For a free trial to the full version of The Wagner Daily or to learn about Wagner's other services, visit MorpheusTrading.com or send an e-mail to deron@morpheustrading.com.
|


 Free Festival of Traders Videos