|
The Wagner Daily ETF Report for March 15
As anticipated, the major indices dipped below their March lows, but a sharp afternoon reversal enabled stocks to close solidly higher. At their mid-day lows, the S&P 500, Nasdaq Composite, and Dow Jones Industrial Average were each trading below support of their March 5 lows and showing losses of 1.0%, 0.8%, and 1.1% respectively. The morning downtrend, however, reversed into a steady afternoon uptrend that enabled the major indices to close above their morning highs. The S&P 500 finished 0.7% higher, the Nasdaq Composite gained 0.9%, and the Dow Jones Industrial Average rallied 0.5%. The small-cap Russell 2000 advanced 0.9%, but the S&P Midcap 400 lagged with a gain of 0.4%. Impressively, all the broad-based indices closed at their intraday highs.
Total volume in the NYSE was 5% higher than the previous day's level, while volume in the Nasdaq ticked 1% higher. Although turnover increased only slightly from the previous day, bear in mind that volume had already spiked much higher on Tuesday. As such, volume in both the NYSE and Nasdaq still came in well above average levels. The combination of the steep reversals off the intraday lows, the closing prices at the highs, and the increase in volume pointed to the first signs of institutional accumulation since the February sell-off began. Market internals were solid as well. Advancing volume in the NYSE exceeded declining volume by a margin of 2 to 1. The Nasdaq ratio was positive by 2.8 to 1. On the surface, those spreads may not seem very substantial, but note that both exchanges made huge recoveries from overly negative ratios earlier in the day.
In yesterday's newsletter, we suggested that each of the major indices were likely to at least probe below their prior March lows, but the big question would be whether or not they stayed below those levels. As if on cue, each index indeed fell well below their respective lows, triggering many sell stops on intraday basis, but stocks concluded the day well above their March lows. Because patterns tend to repeat themselves in the stock market, you may be interested to know that such price action during market corrections is not unusual. Most recently, this pattern occurred during the market's last major correction from May through July of 2006. Below is a daily chart of the S&P 500 from that period:
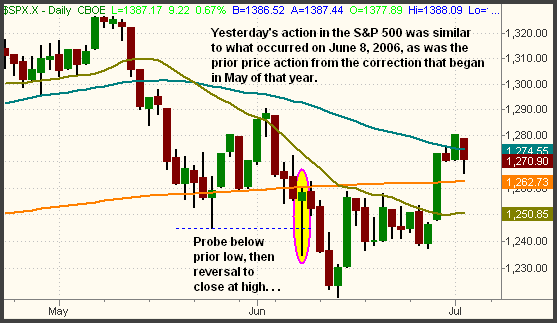
The candlestick circled on the chart above is from June 8, 2006, after the S&P had already been in a downtrend for approximately one month. On that day, the index probed well below its prior low from May 24 on an intraday basis, but reversed to close the session near its intraday high (just like yesterday). But even though that day's action was bullish, the index failed to follow-through. Instead, the S&P fell to the June 8 intraday low only two days later, then the action itself was bullish, then broke below that level on the third day. The market subsequently found support and rallied back, but not before first moving to new lows. Most likely, overhead resistance of the 200-day moving average also played a role in that.
Obviously, the chart example above does not mean the same scenario will occur this time as well, but it demonstrates how the market rarely snaps back from a nasty correction and holds quickly and easily. In a strong market, yesterday's action would most likely lead to immediate follow-through in the coming week, but downtrending markets leave behind a lot of overhead supply that the market must first absorb. Stocks may bounce a little more today, but we would be surprised if the major indices pop back above their March 13 highs anytime soon. Nevertheless, we're prepared either way by focusing on managing existing positions, while avoiding new short entries until we see how things play out over the next few days. Remember that tomorrow is "triple witching" options expiration day, which could result in even more erratic price action today and tomorrow.
Deron Wagner is the Founder and Head Trader of both Morpheus Capital LP, a U.S. hedge fund, and Morpheus Trading Group, a trader education firm launched in 2001 that provides daily technical analysis of the leading ETFs and stocks. For a free trial to the full version of The Wagner Daily or to learn about Wagner's other services, visit MorpheusTrading.com or send an e-mail to deron@morpheustrading.com.
|


 Free Festival of Traders Videos