| The Wagner Daily ETF Report for March 12 |
| By Deron Wagner |
Published
03/12/2007
|
Stocks
|
Unrated
|
|
|
|
The Wagner Daily ETF Report for March 12
The major indices oscillated between positive and negative territory throughout last Friday's session before eventually finishing the day near unchanged levels. It was a tug-of-war between the bulls and bears that caused an upside opening gap to fail, but also lifted stocks off their lows in the final hour. The Nasdaq Composite closed flat, while both the S&P 500 and Dow Jones Industrial Average edged 0.1% higher. Small and mid-cap stocks turned in a better performance. The Russell 2000 and S&P Midcap 400 indices gained 0.5% and 0.4% respectively. All the major market indexes settled in the middle of their intraday ranges, confirming the indecision. For the week, the S&P 500 rallied 1.1%, the Dow Jones advanced 1.3%, and the Nasdaq Composite bounced 0.8%. Given that the S&P and Dow each lost more than 4% the prior week, and the Nasdaq fell nearly 6%, the gains were paltry in comparison with the recent losses.
Turnover in both exchanges fell once again. Total volume in the NYSE was 14% lower than the previous day and was below its 50-day average level for the first time since February 23. Volume in the Nasdaq declined by 2%. The S&P registered a high volume "distribution day" when it bottomed on March 5, then it subsequently began the short-term uptrend that is currently in effect. However, each of the past four days that comprise the uptrend have had successively lighter volume. This tells us the recent correction off the lows has been the result of the sellers taking a break, as opposed to strong institutional buying. Though the stock market could continue to drift a bit higher on light volume, it's akin to skating on thin ice. Once the ice starts to crack, you will fall through the hole very quickly. Just one day of higher volume selling could easily cause stocks to give up most of last week's gains.
The market's short-term uptrend has created numerous setups for short entry. In the March 9 issue of The Wagner Daily, we annotated a chart of the Retail HOLDR (RTH) to illustrate one type of setup we like right now. Any ETF that broke its primary uptrend line at the end of February and is now rallying back into overhead resistance of its 50-day moving average creates an ideal short sale entry with a high risk/reward ratio. In addition to RTH, the iShares Emerging Markets (EEM) now has a similar chart pattern:
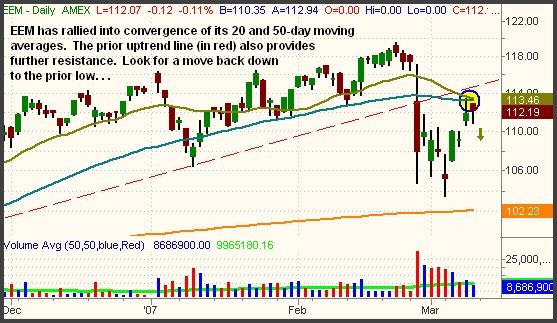
Looking at the chart above, notice how the rally into resistance also occurred on lighter volume than that of the sell-off through March 5. Even though ETFs are synthetic instruments that are not directly correlated with their volume, it still shows a lack of strong demand on the way back up. For setups like this, the proper entry points for short sale are both below the near-term hourly uptrend line and/or below the previous day's intraday low. Ideally, wait for both scenarios in order to lower your risk of a false breakdown and subsequent bullish reversal. A tight protective stop could be placed above the March 8 high and 20/50 day moving average convergence. Since EEM is rather volatile, consider giving the stop at least one point of "wiggle room" above resistance levels.
On the long side of the market, there's nothing we would touch except the inversely correlated ProShares ETFs we have been discussing extensively. If you're a daytrader, go ahead and trade the long side of the market on the individual days with a decisive uptrend. However, if you're a swing trader whose timeframe is longer than intraday, buying just about any stocks or ETFs right now carries very bad odds of profitability. Don't fight the intermediate-term downtrend unless you are very nimble and can quickly reverse your positions.
Last Friday's uneventful action did not change our technical outlook on the major indices. Overall, we view the major indices as currently in a short-term uptrend, within the context of an intermediate-term downtrend. The S&P 500 has retraced about one-third of its loss from the February 22 high down to the March 5 low, while the Nasdaq has recovered less than 25% of its corresponding loss. We could see further gains in the short-term before the intermediate-term downtrend resumes, but there is also no reason to believe the market has enough momentum to go higher. As discussed above, the price to volume relationship in the market remains bearish. Only a session of substantial gains on higher volume could change the pattern.
Deron Wagner is the Founder and Head Trader of both Morpheus Capital LP, a U.S. hedge fund, and Morpheus Trading Group, a trader education firm launched in 2001 that provides daily technical analysis of the leading ETFs and stocks. For a free trial to the full version of The Wagner Daily or to learn about Wagner's other services, visit MorpheusTrading.com or send an e-mail to deron@morpheustrading.com.
|


 Free Festival of Traders Videos