| The Wagner Daily ETF Report for February 27 |
| By Deron Wagner |
Published
02/27/2007
|
Stocks
|
Unrated
|
|
|
|
The Wagner Daily ETF Report for February 27
The S&P 500 and Dow Jones Industrial Average extended their losing streaks to four days yesterday, but another afternoon recovery once again kept the losses to a minimum. Both the S&P and Dow declined only 0.1%, while the other indices were a bit heavier. At its worst intraday level, the Nasdaq Composite was trading 0.9% lower, but the index pared the loss to only 0.4%. The small-cap Russell 2000 and S&P Midcap 400 indices each declined by 0.4% as well. Despite the afternoon buying interest, each of the major indices still closed in the bottom third of their intraday ranges.
Total volume in the Nasdaq decreased by 6% yesterday, while volume in the NYSE was 7% higher than the previous day's level. Like we saw on the higher volume days of February 21 and 22, the minimal 0.1% loss in the S&P was not large enough to declare the session a "distribution day." Nevertheless, unless it closes near its intraday high, it's generally considered negative when an index declines on higher volume. In the S&P and Dow, this "churning" action has occurred in three of the last five days. The singular "up" day during that period registered lower volume. The price to volume relationship in the Nasdaq has been much better "under the hood." There have only been two days of losses in the past five sessions, both of which were on lighter volume. One of the three "up" days was a higher volume "accumulation day."
Yesterday, we listed a handful of sector ETFs we were watching for potential long entry in the coming week. Most of these declined slightly yesterday, although both the StreetTRACKS Gold Trust (GLD) and iShares Silver Trust (SLV) continued to build on their gains. The Utilities HOLDR (UTH), which surged 3.0%, was the biggest winner yesterday. However, the rally was primarily driven by unexpected acquisition news of utility bellwether TXU Corp (TXU). The Semiconductor HOLDR (SMH) continues to consolidate just below the pivotal breakout level of $35.95.
Another ETF that recently came onto our watchlist for potential breakout is the iShares Nasdaq Biotech (IBB). For the past two months, IBB has been consolidating just below its one-year downtrend line. Over the past several weeks, the range has tightened considerably, indicative of the type of volatility contraction that often precedes breakouts. Looking at the weekly chart below, notice how it also resembles a long-term, bullish "cup and handle" pattern. A rally above the November 20 high of the "handle," at $82.15, would confirm the breakout:
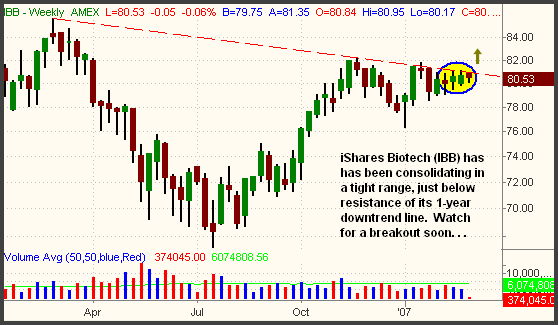
Because of disproportionately high weightings in a few underperforming biotechs such as Amgen, Inc. (AMGN) and Biogen Idec (BIIB), the popular Biotech HOLDR (BBH) has been showing relative weakness to IBB for the past month. BBH is also too far off its January high and lacks any type of decent consolidation. As such, IBB will most likely yield a better gain than BBH in the event of a breakout in the Biotech Index ($BTK).
When trying to determine which ETF family within a particular industry sector is the best one to buy, we recommend the use of a "percentage change" overlay chart in order to compare relative strength. Rather than plotting actual prices, a "percentage change" chart simply shows the percentage that a stock or index has risen or fallen over a given period of time. When overlaid with several other stocks or indexes, this type of chart is great for enabling you to quickly determine which equity has the most relative strength. The one that does will generally gain more on the "up" days and lose less than the other equities on the "down" days. Below is such a "percentage change" chart that compares the price action of IBB, BBH, and the $BTK index over the past month:
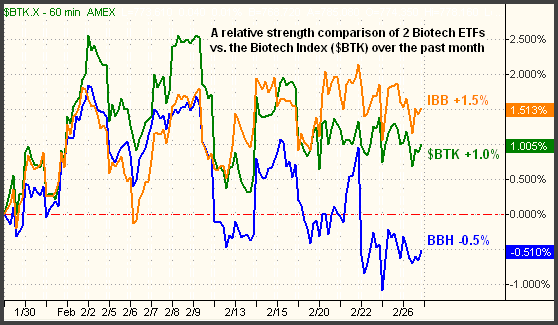
Do you now see that, over the past month, BBH has been trending sideways to lower, while IBB has been trending sideways to higher? If the $BTK index soon breaks out, odds are pretty good that IBB will reap a higher gain than BBH.
As for the downside, several sectors sold off sharply yesterday. The Dow Jones Transports ($DJT) plummeted 2.4%, giving back all of its gain since the February 14 breakout. More important, however, has been the major weakness in the Securities Broker-Dealer Index ($XBD) over the past two days. Having shed 3.5% over the past two sessions, the $XBD index closed yesterday below its 50-day moving average for the first time since its current uptrend began back in September of 2006. Volume has also picked up substantially in the stocks that have been leading the sell-off. The bearish action in the sector is significant because the performance of the $XBD tends to act as a leading indicator for the direction of the S&P and Dow. This is similar to how the Semiconductor Index ($SOX) usually leads the Nasdaq. Below is the daily chart of the $XBD index:
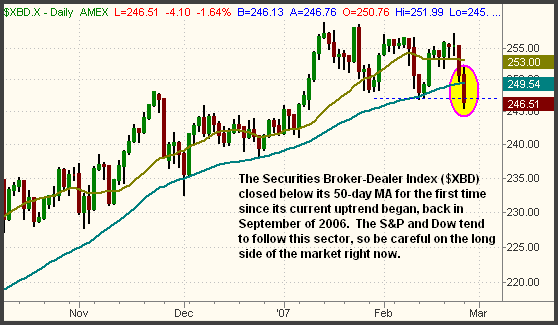
Is the sudden relative weakness in these investment banks merely a normal correction, or a sign of greater trouble ahead? It's still a bit too early to determine, but it is definitely a good reason to continue playing the long side of the market conservatively by keeping both a reduced number of positions and smaller overall share size.
Deron Wagner is the Founder and Head Trader of both Morpheus Capital LP, a U.S. hedge fund, and Morpheus Trading Group, a trader education firm launched in 2001 that provides daily technical analysis of the leading ETFs and stocks. For a free trial to the full version of The Wagner Daily or to learn about Wagner's other services, visit MorpheusTrading.com or send an e-mail to deron@morpheustrading.com.
|


 Free Festival of Traders Videos