| The Wagner Daily ETF Report for February 22 |
| By Deron Wagner |
Published
02/22/2007
|
Stocks
|
Unrated
|
|
|
|
The Wagner Daily ETF Report for February 22
The Nasdaq recovered from morning weakness to finish higher for the third consecutive session, but increasing relative weakness in the S&P and Dow caused mixed results in the broad market. Shaking off an opening drop of 0.5%, the Nasdaq Composite once again showed resiliency by trending higher intraday and closing with a 0.2% gain. The small-cap Russell 2000 also advanced 0.2%, as the S&P Midcap 400 rallied 0.3%. The S&P 500 recovered most of its earlier loss, but still finished 0.1% lower. The Dow Jones Industrial Average lagged significantly with its 0.4% loss.
Total volume in the Nasdaq was 7% lighter than the previous day's level, preventing the index from scoring another bullish "accumulation day." Worse is that volume in the NYSE increased by 8%. Despite its higher volume loss, the 0.1% drop in the S&P 500 was not enough to label the session a "distribution day." Nevertheless, it was negative that turnover increased and the index was nearly flat. Such action is known as "churning" because a lot of shares are changing hands, but without a corresponding increase in stock prices. When it occurs after an extended rally, "churning" is typically the result of stealth institutional selling into strength. To professional traders, it is often a warning sign of subsequent distribution on the horizon.
Of the major industry sector ETFs, the StreetTRACKS Gold Trust (GLD) was one of the biggest winners yesterday. As you may recall, we initially bought GLD on January 23, then began to trail a stop higher as it rallied in February. On February 15, we locked in a solid profit when it hit our trailing stop. Two sessions later, on February 20, it gapped down to close at an eight-day low. One might have expected further weakness yesterday, but the prior day's action was apparently a "shakeout." Support of the 20-day moving average helped GLD to rocket 3.1%, on more than double its average daily volume, and close at a nine-month high. More importantly, GLD broke out above resistance of its July 14 high that triggered the correction a few days ago. This is illustrated on the weekly chart below:

Because GLD has broken out above its prior significant high from last July, that level should now act as support. That prior high is a $66.42, so any pullback to that level will provide an ideal re-entry opportunity in GLD. If GLD gaps down to that area in today's session, we plan to buy it. An entry around the $66.50 area would enable us to re-enter GLD only slightly higher than where we closed the position last week, but without the additional risk we would have incurred from holding through a correction. If, however, GLD gaps up and immediately takes off again, we will not chase it.
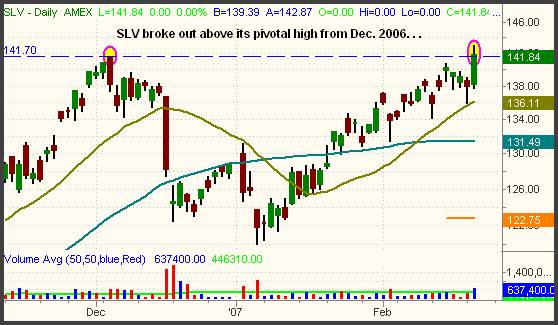
It's not only gold that shined yesterday, as the silver sector rallied sharply as well. The iShares Silver Trust (SLV) zoomed 2.9% higher yesterday and closed above pivotal resistance of its December 5 high. From here, SLV has a good chance of testing its May 2006 high, around the $152.50 area. The breakout above the prior high from December is illustrated on the daily chart below:

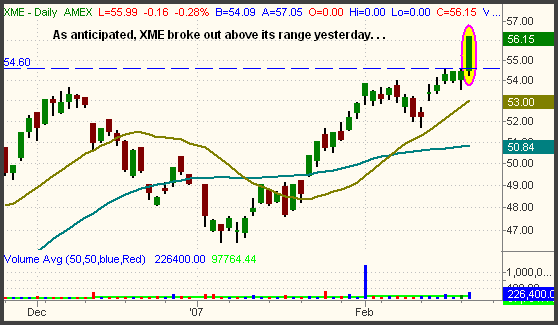
Also turning in an impressive performance yesterday was the StreetTRACKS Metal & Mining (XME), which surged 3.2% and closed at a new record high. We have pointed out the setup in this ETF several times over the past week, so kudos to those who bought the breakout above consolidation yesterday:

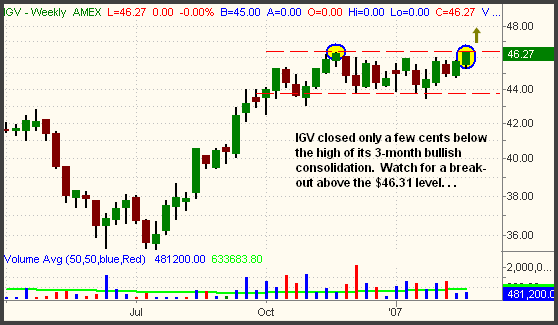
Of the other ETFs that have been on our watchlist, iShares Software (IGV) closed yesterday just below its trigger point. As you can see on the chart below, a rally above the November 2006 high of $46.31 would represent a breakout above the 3-month band of consolidation:

iShares China (FXI), another ETF that has been on our watchlist, technically triggered an entry point by moving above the upper channel of its "symmetrical triangle" and trading above its February 8 high of 107.50. However, we are not yet excited about buying it because its prior momentum seems to have dried up.
Deron Wagner is the Founder and Head Trader of both Morpheus Capital LP, a U.S. hedge fund, and Morpheus Trading Group, a trader education firm launched in 2001 that provides daily technical analysis of the leading ETFs and stocks. For a free trial to the full version of The Wagner Daily or to learn about Wagner's other services, visit MorpheusTrading.com or send an e-mail to deron@morpheustrading.com.
|