| The Wagner Daily ETF Report for February 6 |
| By Deron Wagner |
Published
02/6/2007
|
Stocks
|
Unrated
|
|
|
|
The Wagner Daily ETF Report for February 6
The S&P 500 snapped its four-day winning streak, as all the major indices except the Dow closed slightly lower. The S&P 500 lost 0.1% and the Nasdaq Composite slipped 0.2%, but the Dow Jones Industrial Average eked out a 0.1% gain. The S&P Midcap 400 Index maintained its newfound relative strength by finishing unchanged. The small-cap Russell 2000 declined 0.3%. Like the previous day, stocks spent the entire session in a tight, sideways range, digesting their recent gains.
Total volume in the Nasdaq ticked 1% higher than the previous day's level, but volume in the NYSE was 1% lighter. Although the Nasdaq posted a loss on higher volume, a mere 1% increase in turnover was not enough to label the session a bearish "distribution day." Rather, the narrow range of the broad market and relatively small price movements in the major indices were more indicative of normal price consolidation. In the NYSE, advancing volume was on par with declining volume. The Nasdaq volume ratio was marginally positive at 1.3 to 1.
In yesterday's The Wagner Daily, we analyzed the long-term monthly chart of the S&P 500 in order to see the "big picture" of where the benchmark index stands. As a follow-up, today we'll take a look at the monthly charts of the other two benchmark indices, the Nasdaq Composite and the Dow Jones Industrial Average. In case you missed yesterday's analysis on the S&P 500, please click here to review that piece first. Otherwise, take a look at the monthly chart of the Nasdaq Composite below:
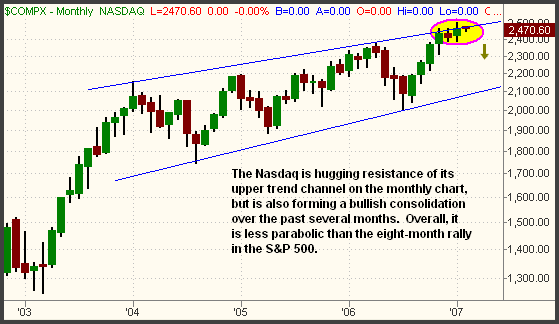
In comparison with the S&P 500, notice that the Nasdaq is less extended overall. Unlike the S&P, which has closed higher for eight consecutive months, the Nasdaq rallied from August through November of 2006, then entered a period of consolidation from December through January. Such consolidation at the top of a range ("correction by time") is generally bullish because it forms a base of support that eventually allows stocks to make another leg higher. However, notice that the Nasdaq is also trading at resistance of the upper channel of its primary uptrend. As such, it may first need to correct by price, at least down towards the middle of its trend channel, before rallying significantly higher. Generally speaking, the Nasdaq is less "overbought" than the S&P 500 on its long-term chart, but is still trading at resistance of its upper trend channel. Next, check out the monthly chart of the Dow Jones Industrials:

Because the Dow broke out to a new record high in October 2006 after several years of sideways consolidation, its current uptrend channel is technically less significant than whether or not it holds above the pivot of its breakout point. Like the S&P, the Dow has not had such a monthly winning streak for more than ten years. Trading at an all-time high, the Dow technically has no overhead resistance, but all indexes and stocks eventually correct within the context of their trends. When it eventually does, look for the Dow to find major support at the prior high of January 2000 (the blue dashed horizontal line). If you've been waiting for a decent correction in the Dow before buying stocks or ETFs in a long-term retirement account, any pullback down to near that level presents an ideal entry point.
As for the short-term technical outlook of the broad market, not much has changed over the past several days. The S&P and Dow lack meaningful overhead supply to hold them down, but buying interest has been subdued as well. Traders are likely a bit cautious on the long side due to the lack of corresponding bullishness in the Nasdaq. The 2,470 to 2,480 area has become a rather pivotal level in the Nasdaq. If the index can break out above that range, new highs could easily follow. However, an inability to soon break out above that level should result in the Nasdaq falling back down below its 50-day MA.
Deron Wagner is the Founder and Head Trader of both Morpheus Capital LP, a U.S. hedge fund, and Morpheus Trading Group, a trader education firm launched in 2001 that provides daily technical analysis of the leading ETFs and stocks. For a free trial to the full version of The Wagner Daily or to learn about Wagner's other services, visit MorpheusTrading.com or send an e-mail to deron@morpheustrading.com.
|


 Free Festival of Traders Videos