| The Wagner Daily ETF Report for February 1 |
| By Deron Wagner |
Published
02/1/2007
|
Stocks
|
Unrated
|
|
|
|
The Wagner Daily ETF Report for February 1
After shaking off opening weakness, stocks traded in a narrow, sideways range until a positive reaction from the afternoon Fed announcement on interest rates triggered a late-day rally. The major indices surged higher after the Federal Reserve Board failed to say anything surprising during the 2:15 pm announcement. Stocks backed off their intraday highs in the final thirty minutes of the session, but still closed with respectable gains. The Nasdaq Composite advanced 0.6%, the S&P 500 Index 0.7%, and the Dow Jones Industrial Average 0.8%. The small-cap Russell 2000 and S&P Midcap 400 indices both closed at new record highs after posting gains of 0.3% and 0.7% respectively.
Not surprisingly, turnover was light in the first half of the day, but spiked higher in the final ninety minutes of trading. Total volume in the NYSE rose 13%, while volume in the Nasdaq was 25% higher than the previous day's level. The solid gains in the S&P and Nasdaq, combined with the significantly higher volume, enabled both exchanges to register bullish "accumulation days" yesterday. Volume in both the NYSE and Nasdaq also swelled above 50-day average levels, confirming the institutional support of the late-day rally. Market internals were positive, but not as strong as could be expected. Advancing volume in the NYSE exceeded declining volume by a margin of 2.7 to 1, while the Nasdaq ratio was positive by 2 to 1.
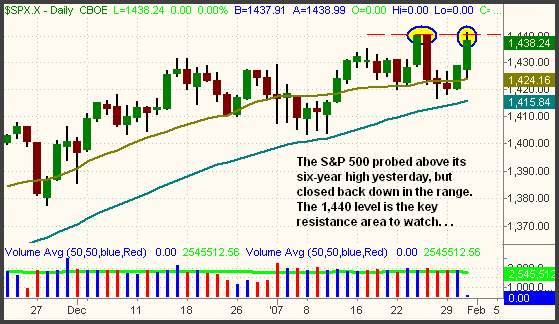
All the major indices moved higher yesterday, but unfortunately, most of them remain stuck in a sideways range. The S&P 500 probed above resistance of its six-year high yesterday afternoon, but drifted back down to finish in its prior range. Support of the 50-day MA has held firmly intact, and that moving average has now converged with the January 26 "swing low." Conversely, key resistance on the S&P 500 is now at the 1,440 level (the dashed horizontal line on the chart below):

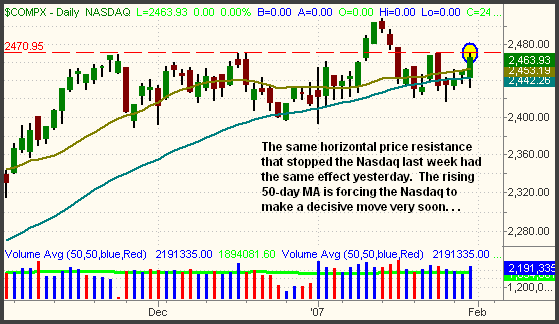
Since the Nasdaq Composite has been in a sideways range for so long, support of the 50-day moving average has finally risen to near its current price. Yesterday, the index rallied off support of its 50-MA, but again ran into horizontal price resistance of the 2,470 level. As illustrated on the chart below, that is the level where the rally attempt stalled on January 24 and 25 as well. We expect the Nasdaq to break out of its volatility contraction within the next one to three days, so keep an eye on the 2,470 level as resistance and the 50-day MA (2,442) as support. A close above resistance or below support will likely lead to high momentum in the direction of the break for at least a couple of days:

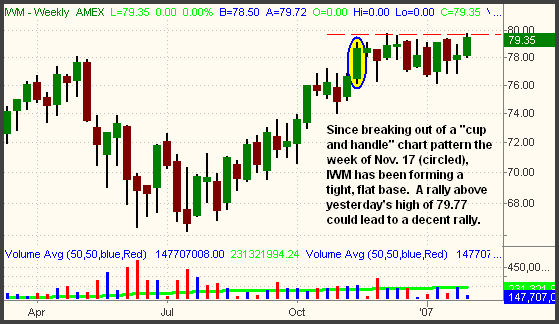
Although its shorter-term daily chart is a bit choppy, the long-term weekly chart of the Russell 2000 Index is looking quite bullish. Since breaking out of a bullish "cup and handle" chart pattern the week of November 17, 2006, the Russell has been forming a flat base that has lasted almost three months. Yesterday, the index set a new all-time closing high, and also probed above the intraday high of December 25. With a bit of buying pressure, the Russell could bust out firmly above the high of its multi-month consolidation. The longer a stock or ETF consolidates, the more momentum the eventual breakout will have. As such, we are now stalking the iShares Russell 2000 (IWM) for a potential long entry above yesterday's high. Note the tight band of consolidation on the weekly chart of IWM below:

The knee-jerk reaction to yesterday's Fed comments was encouraging, but bear in mind the stock market often moves in the opposite direction a few days later. We're not trying to be bearish here, but merely warning you not to get caught up in the excitement of the post-Fed rally until after traders and investors have had a chance to digest the real meaning of the Fed comments. With both the S&P and Nasdaq stuck in the middle of their ranges, whippy and erratic trading action could remain the dominant theme as we enter the month of February. As mentioned several times last month, capital preservation, not scoring large profits, should be your top priority as long as most of the major indices stay range-bound.
Deron Wagner is the Founder and Head Trader of both Morpheus Capital LP, a U.S. hedge fund, and Morpheus Trading Group, a trader education firm launched in 2001 that provides daily technical analysis of the leading ETFs and stocks. For a free trial to the full version of The Wagner Daily or to learn about Wagner's other services, visit MorpheusTrading.com or send an e-mail to deron@morpheustrading.com.
|