The stock market concluded the first week of the new year on a negative note, causing most of the major indices to close at their lowest levels in more than a month. After gapping down on the open, stocks trended lower throughout the morning session, stabilized at mid-day, then traded in a sideways range throughout the afternoon. The S&P 500 fell 0.6%, the Dow Jones Industrial Average 0.7%, and the Nasdaq Composite 0.8%. Although strength in the techs enabled the Nasdaq to show surprising relative strength the previous day, this time the index moved lower alongside of the S&P and Dow. Small and mid-cap stocks suffered the worst losses, as the Russell 2000 plummeted 1.8% and the S&P Midcap 400 declined 1.1%.
The only positive thing about last Friday's session is that the losses occurred on slightly lower turnover. Total volume in the NYSE declined by 1%, while volume in the Nasdaq was 5% lower than the previous day's level. If volume had increased instead, it would have been the second "distribution day" within three sessions. Nevertheless, the higher than average volume levels showed that institutional selling was not completely absent. Market internals were firmly negative as well. In the NYSE, declining volume exceeded advancing volume by a margin of nearly 3 to 1. The Nasdaq ratio was negative by 2.3 to 1.
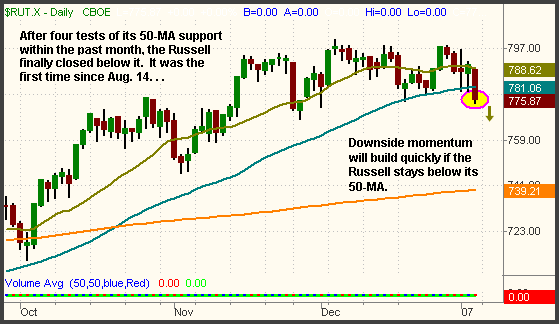
The new year got off to a choppy start with the erratic and indecisive price action of January 3 and 4, but finished the week decidedly lower. Though the Nasdaq held up well and even secured a gain last week, the other indices are starting to look rather bearish on their daily charts. The small-cap Russell 2000 Index, typically a leading indicator of the broad market's health, closed below its 50-day moving average for the first time since the current uptrend began back in August of 2006. Throughout December, it touched and bounced off support of its 50-MA on four separate occasions, but each subsequent test weakened the support level until it finally broke down last Friday. This is illustrated on the daily chart of the Russell 2000 below:

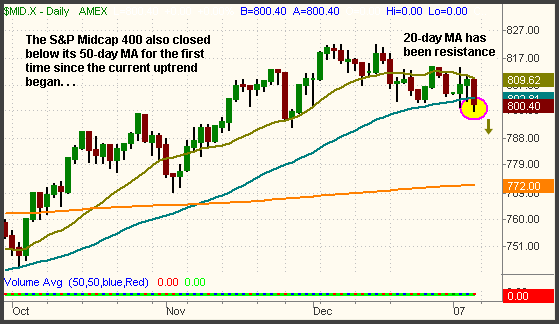
Over the past several years, monitoring the performance of the Russell 2000 has become very important because the index has led the other indices in both bullish and bearish reversals. In the first several years of the new millennium, traders found that the Semiconductor Index ($SOX) was one of the best leading indicators of the overall market's health, but that has changed in recent years. While the direction of the heavily weighted $SOX is still important, the index has lost a lot of its luster as earnings growth in most chip companies has slowed. Instead, institutional money flow into small-cap companies, typically focused on aggressive earnings growth, has become an accurate way to determine the level of confidence institutional traders have in the state of the market. The $SOX index, for example, has been trading in a wide, sideways range since 2003, but the Russell has been trending steadily higher over the past three years, continually setting new all-time highs. The S&P Midcap 400 Index has become a similar leading indicator, which is why we discuss the performance of both the Russell and S&P Midcap indices on a daily basis. The S&P Midcap 400, which we remain short via the UltraShort MidCap 400 ProShares (MZZ), also closed below its 50-day MA last Friday:

The benchmark S&P 500 is still above its 50-day MA, but has begun to roll over as well. As you can see, the index closed at lowest level of the past four weeks and now has overhead resistance of its 20-day MA. Watch closely to see how the S&P reacts on the likely test of its 50-day MA:

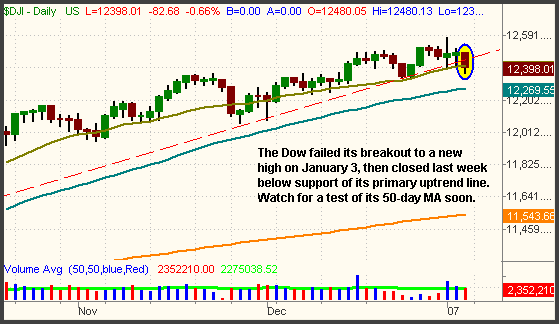
The Dow Jones failed its rally attempt to a new record high on January 3, trapping the bulls who bought the intraday breakout. It then closed last week just below support of its primary uptrend line that has been in place since the low of July 2006. A break below last Friday's low will confirm the break of trendline support, which would subsequently lead to a test of the Dow's 50-day MA in short order:

Thanks to its solid gain on January 4, the Nasdaq Composite is still above its 50-day MA, but trading action has been very choppy. Unless the index makes a clean break below last week's low of 2,394, we recommend avoiding the indecisive Nasdaq for now.
When the broad market is trending steadily in one direction or the other, the broad-based ETFs are ideal trading vehicles. Conversely, choppy, sideways markets are better suited for trading specific industry sectors with relative strength or weakness to the broad market. When the major indices were range-bound in December, we focused on ETFs with the most relative strength and weakness to the major indices, as opposed to the broad-based ETFs. However, it appears that a "changing of the guards" is taking place, which is causing the market to begin a new trend lower. Obviously, it's impossible to know how long the current correction will last, but we plan to trade the broad market on the short side as long as it does. If the bearish action in the Russell and S&P Midcap remains an accurate forecast of things to come, astute traders will take that as a serious warning sign to entering new long positions. Finally, remember that the new ProShares ETFs are a better way to trade the broad market on the short side because they can be traded in a cash account (such as an IRA), and they also provide leverage that enables you to capture more volatility with less buying power. The traditional SPY, DIA, and QQQQ are losing market share to the ProShares ETFs, and we certainly understand the reasons why, especially for short-term traders.
Deron Wagner is the Founder and Head Trader of both Morpheus Capital LP, a U.S. hedge fund, and Morpheus Trading Group, a trader education firm launched in 2001 that provides daily technical analysis of the leading ETFs and stocks. For a free trial to the full version of The Wagner Daily or to learn about Wagner's other services, visit MorpheusTrading.com or send an e-mail to deron@morpheustrading.com.