Stocks posted another session of losses last Friday, causing several of the major indices to break below key support levels ahead of the holiday weekend. Both the Nasdaq Composite and Dow Jones Industrial Average lost 0.6%, while the S&P 500 shed 0.5%. The small-cap Russell 2000 declined 0.3% and the S&P Midcap 400 closed 0.4% lower. Each of the major market indexes finished at their intraday lows and at their worst levels of the week. For the week, the Nasdaq Composite slid 2.3%, the S&P 500 1.1%, and the Dow Jones 0.8%. Not only did the Nasdaq give back a sizeable portion of its recent gains, but the index also posted losses every day last week.
As expected, volume was rather tepid ahead of the extended holiday weekend. Total volume in the NYSE declined by 27%, while volume in the Nasdaq was 25% lighter than the previous day's level. The S&P and Nasdaq have both posted losses in each of the past three days, but each session has posted declining volume. This is positive because it indicates a lack of institutional distribution, but many traders were absent from their desks ahead of the holiday weekend anyway. Therefore, the losses on lighter volume may be a bit deceiving. Unfortunately, volume is unlikely to pick up again until after the New Year's Day holiday has passed. Price action has been negative lately, but it will be difficult to determine the market's true underlying health until volume returns to the markets next week.

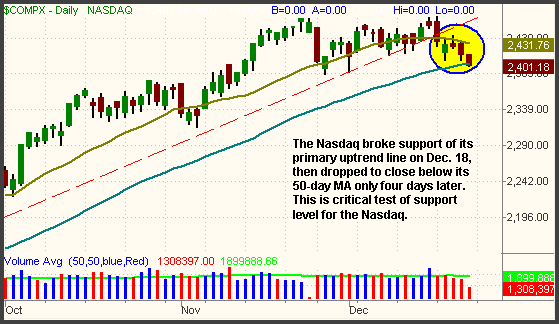
Despite the low turnover, several important technical events occurred last Friday. Most notable was the Nasdaq Composite's close below the 50-day moving average for the first time since the current uptrend began back in mid-August. Since the index broke support of its primary uptrend line early last week, it's not surprising that it fell below its 50-day MA a few days later. We have illustrated this on the chart below:

Because the Nasdaq closed below this pivotal moving average only one day so far, we can not declare an "official" break of the 50-day MA. Often, an index will dip below key support levels such as the 50-day MA, run all the sell stop orders, then pop back above it the next day. However, even if the Nasdaq attempts to move back above its 50-MA, firm overhead resistance has now been established at the prior uptrend line. The 20-day MA should also provide resistance. Remember that a prior support level becomes the new resistance level after the support is broken. Since we are positioned in the UltraShort QQQQ ProShares (QID), currently showing a solid gain, we will be on alert for a failed breakdown in the Nasdaq. If we detect strong buying programs near the 50-MA, we will tighten our stop to reduce risk.
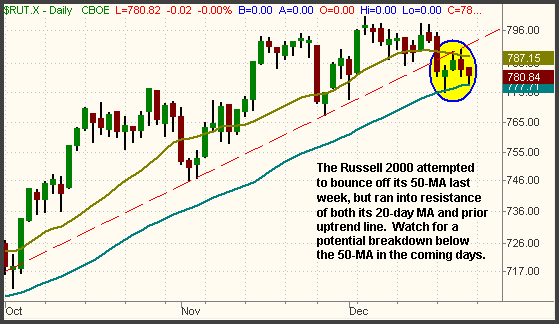
The Russell 2000 Index, a leading indicator of the broad market's health, bounced of support of its 50-day MA on December 19. However, it ran into overhead resistance of its 20-day MA and prior uptrend line the following day. Two days later, it has once again closed right at the 50-day MA. With such a feeble rally attempt off the 50-MA, it would not take a lot of selling pressure to cause the Russell to break below its 50-MA in the coming days. In case you are interested in shorting a breakdown, the iShares Russell 2000 (IWM) is the ETF that tracks the index:

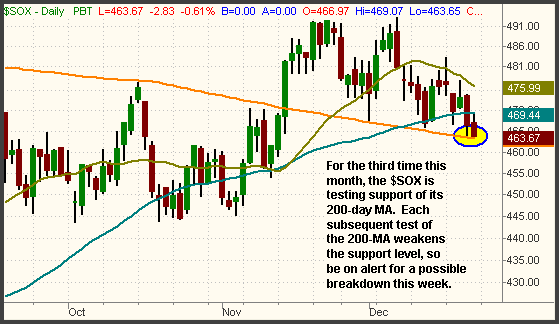
In the December 14 issue of The Wagner Daily, we pointed out how the Semiconductor Index ($SOX) had closed at major support of its 200-day moving average. We explained why it was likely to bounce at that level, which it did, but also mentioned that a mild bounce would only put the index in the middle of its range ("no man's land"). Two weeks later, the $SOX has once again closed at support of its 200-day MA:

When a stock or index tests support of its 200-day MA on several occasions within a short period of time, each subsequent test increases the odds of a breakdown. Since this is the third time the $SOX has tested its 200-day MA this month, we are definitely on alert for a potential breakdown below the 200-MA this time. If that happens, it will obviously have a negative effect on the chip-heavy Nasdaq Composite. The $SOX tends to lead the Nasdaq, which in turn leads the S&P and Dow.
Given the close proximity of both the $SOX and the Nasdaq to the key support levels illustrated above, it is risky to initiate new short positions at current levels. If you're already short, just keep trailing your stops lower, perhaps above the hourly downtrend lines, in order to protect your gains. If you're long, consider selling your positions into strength of the next bounce. If the Nasdaq manages to climb back above its 20-day MA and prior uptrend line, you can buy back into your positions. But if the Nasdaq bounces and begins to roll over again, you can dump any remaining long positions, then initiate new short positions at a low-risk price level.
Deron Wagner is the Founder and Head Trader of both Morpheus Capital LP, a U.S. hedge fund, and Morpheus Trading Group, a trader education firm launched in 2001 that provides daily technical analysis of the leading ETFs and stocks. For a free trial to the full version of The Wagner Daily or to learn about Wagner's other services, visit MorpheusTrading.com or send an e-mail to deron@morpheustrading.com.