The major indices meandered in a tight, sideways range throughout the entire day before finishing with minor losses. The S&P 500 ticked 0.1% lower, the Dow Jones Industrial Average slipped 0.2%, and the Nasdaq Composite lost 0.3%. The small-cap Russell 2000 and S&P Midcap 400 indices declined by 0.2% and 0.1% respectively. The narrow, five-point intraday range of the S&P 500, as well as the correspondingly insignificant ranges of the other indices, did little to change the technical picture of the broad market. Overall, it was just a quiet and uneventful session in which stocks paused to digest their recent gains.

Turnover was marginally lower across the board. Total volume in the NYSE was 1% lighter than the previous day's level, while volume in the Nasdaq declined by 2%. It was the first day since the abbreviated, post-holiday session on November 24 that volume in the Nasdaq was below its 50-day average level. In the NYSE, it was the third straight session in which less shares than average changed hands. Market internals were negative, but not by a wide margin. In both exchanges, declining volume exceeded advancing volume by a ratio of approximately 5 to 4.
One sector we are watching in the coming days is the Oil Service Index ($OSX). On November 30, we sold our long position in the Oil Service HOLDR (OIH) into strength, near its intraday high. Though we netted a substantial profit on the trade, we have continued to monitor the sector's price consolidation over the past week because we feel the sector may be setting up for further upside. Whether or not that happens is dependent on the ability of the index to break out above pivotal resistance at the 213 level. Looking at the weekly chart below, notice how the 213 level corresponds with horizontal price resistance from both July and August of this year (circled in blue):
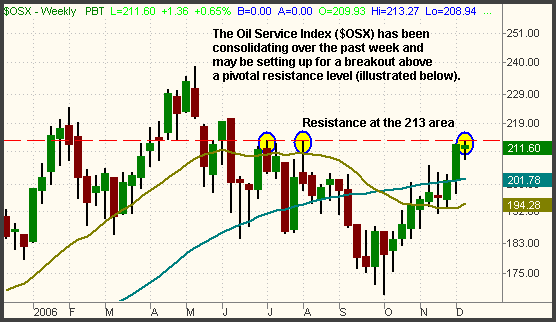
Based on decent chart patterns of the individual stocks that comprise the $OSX, we think the index is indeed capable of making another leg higher. However, it could easily require another one to two weeks of consolidation, as a "correction by time," in order to build up enough momentum to break out firmly above the 213 resistance level. This expectation is the reason we locked in the gain on our OIH position last week rather than holding it through weeks of consolidation. Although we are no longer positioned in OIH, a bullish pattern in the price of the crude oil commodity prompted us to buy the U.S. Oil Fund (USO) two days ago.
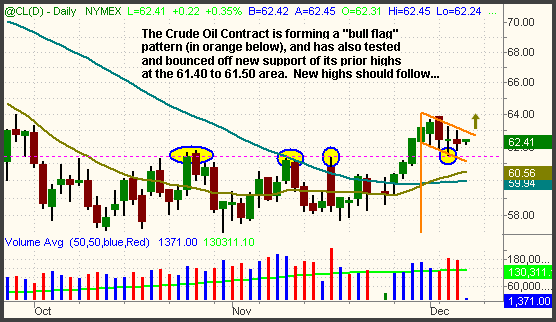
On November 27, the Crude Oil Continuous Contract (@CL) popped firmly back above its 50-day moving average for the first time since mid-August of this year. It trended steadily higher in the four days that followed, then began a modest correction on December 4. Its downward retracement over the past four days has resulted in the formation of a "bull flag" pattern on the daily chart of both crude oil and USO. The low of the "bull flag" pattern which occurred on December 5 also corresponded with a test of support around the 61.40 to 61.50 area. We have drawn the "bull flag" pattern with orange lines on the daily chart of crude oil below. The blue ellipses illustrate how USO tested new support of its prior highs at the 61.40 to 61.50 area:
Although not shown, USO has a similar chart pattern to the crude oil contract shown above. We expect USO to break out from its "bull flag" pattern within the next several days. We stopped out of USO when we bought it near the beginning of last month, but our entry at the time was more anticipatory because it lacked the confirmation of a "bull flag" above the 50-day MA. We still are in "sitting on hands" mode (SOH), but the good thing about USO is that it is not directly correlated to the direction of the stock market.
Deron Wagner is the Founder and Head Trader of both Morpheus Capital LP, a U.S. hedge fund, and Morpheus Trading Group, a trader education firm launched in 2001 that provides daily technical analysis of the leading ETFs and stocks. For a free trial to the full version of The Wagner Daily or to learn about Wagner's other services, visit MorpheusTrading.com or send an e-mail to deron@morpheustrading.com.


 Free Festival of Traders Videos