Stocks moved modestly higher in the first hour of yesterday's session, then drifted sideways, in a narrow range, throughout the remainder of the day. All the major indices finished higher, but weakness in the tech arena caused the Nasdaq to lag. Both the S&P 500 and Dow Jones Industrial Average gained 0.4%, as the Nasdaq Composite, small-cap Russell 2000, and S&P Midcap 400 indices each advanced 0.2%. After the opening rally subsided, the subsequent intraday trading range became rather tight. Still, the S&P 500 finished near its best level of the day and closed at another new six-year high. The Dow remained stuck at resistance of its prior uptrend line that we illustrated in yesterday's newsletter.

Total volume in the NYSE increased by 10% yesterday, enabling the S&P to register an "accumulation day," but turnover was still below its 50-day average level. In the Nasdaq, volume was only 1% higher than the previous day's level. As long as stocks remain in an overall trend of declining volume below average levels, extra caution should be taken when entering new long positions. It only takes a one day spike in selling volume to wipe out many days of light volume gains, which is what occurred on November 27. Market internals were mixed. Advancing volume in the NYSE exceeded declining volume by a margin of 1.9 to 1, while the Nasdaq volume ratio was flat.
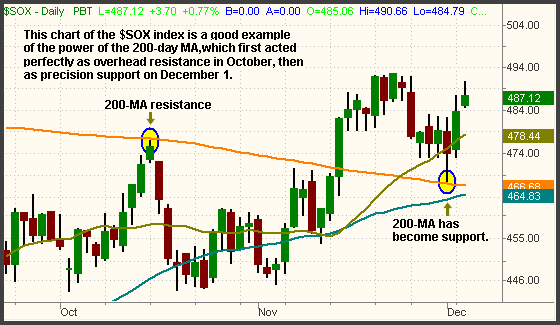
As always, one major factor weighing on whether the Nasdaq breaks out to a new high or forms a lower high and reverses is the direction of the Semiconductor Index ($SOX). Last week, the $SOX fell below the low of its prior consolidation, but bounced off major support of its 200-day moving average. Just as the 200-day MA acted as a brick wall that stopped the rally attempt on October 16, it did exactly the opposite on December 1. For educational purposes, this is a great example of how a prior resistance level becomes the new support level after the resistance is broken. It also shows how the 200-day MA nearly always triggers a bounce when acting both as either support or resistance:

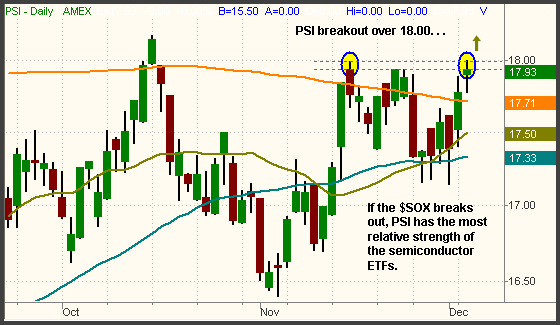
As you can see, the $SOX is now trapped in "no man's land." The 200-day MA, as well as the rising 50-day MA, are both acting as support from below, but resistance from the high of the prior consolidation is overhead. This "tug-of-war" could easily keep the $SOX trapped in a range over the next few weeks, which would keep the Nasdaq volatility in check as well. However, in the event that the $SOX manages to break out to the upside, it's good to have a plan of action. The Semiconductor HOLDR (SMH) and iShares Semiconductor (IGW) are both following a similar pattern to the $SOX index itself, but one ETF showing relative strength to the index is the PowerShares Semiconductor (PSI):

Unlike the $SOX, notice that PSI closed yesterday right at the high of last month's consolidation. Its relative strength to the $SOX index means it should be the top performing ETF in that sector if the semis break out. The buy trigger in PSI is above horizontal price resistance at 18, but buying it without the $SOX first proving it can break out above its recent consolidation is a risky proposition.
Regarding the broad market, there's not much new to say other than it remains rather resilient. All the major indices continue to grind higher, although the Dow is still in dangerous territory, right at resistance of it its prior uptrend line. The recovery from the November 27 selloff has lacked overall conviction, but being short is pretty tough as well. For that reason, we remain in SOH mode ("sitting on hands") with regard to any ETFs that are closely correlated to the broad market. International, commodities, and currency ETFs are good places to look for non-correlated ETFs. When the market begins giving us clear signals that are all in line, we will be ready for new trade entries in whichever direction it goes.
Deron Wagner is the Founder and Head Trader of both Morpheus Capital LP, a U.S. hedge fund, and Morpheus Trading Group, a trader education firm launched in 2001 that provides daily technical analysis of the leading ETFs and stocks. For a free trial to the full version of The Wagner Daily or to learn about Wagner's other services, visit MorpheusTrading.com or send an e-mail to deron@morpheustrading.com.