Like the previous session, stocks oscillated in an indecisive fashion, but this time the major indices finished near unchanged levels. The broad market recovered from morning weakness at mid-day, but a selloff in the final ninety minutes of trading pushed stocks back down towards the flat line. The S&P 500 advanced 0.1%, while both the Nasdaq Composite and Dow Jones Industrial Average closed less than 0.1% lower. Small and mid-cap stocks were resilient, enabling both the Russell 2000 and S&P Midcap 400 indices to gain 0.3%. Each of the major indices wrapped up the day near the middle of their intraday ranges, confirming the intraday indecision.
Total volume in the NYSE rose 22% yesterday, while volume in the Nasdaq was 10% higher than the previous day's level. Given that the broad market was little changed, the higher turnover could be correctly interpreted as institutional "churning." When volume increases significantly, but prices are little changed, this is a bearish sign known as "churning." It indicates that volume picked up as traders tried to rally stocks, but there was equally enough selling pressure to overcome the buying programs. Days like these are when the "smart money" sells into strength, but the general public doesn't notice. When the market spins its wheels near the top of range, as it did yesterday, such action often preceds a selloff. Astute traders should view yesterday's "churning" as a warning sign, especially considering that stocks have not fully recovered from the November 27 selloff.
In yesterday's The Wagner Daily, we pointed out how the Banking Index ($BKX) was setting up on the short side. It acted as expected yesterday, closing slightly lower, so we still anticipate it will soon roll over. In addition to Banking, it looks like Retail ($RLX) may follow suit to the downside as well. Take a look:
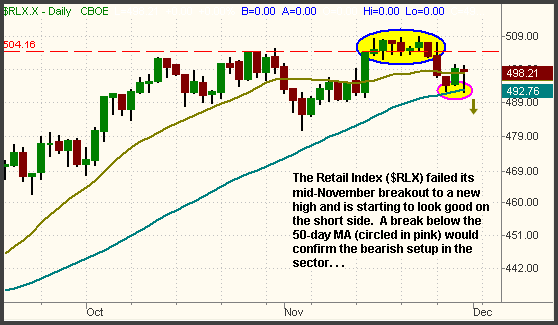
In the middle of November, the $RLX index broke out to a new high, then consolidated in a tight range for nearly two weeks. Normally, such action would be quite bullish, but the consolidation failed when the index broke below its 20-day MA on November 27. It is now struggling to hold support of its 50-day MA, but a break below it will send the retail stocks firmly lower. When a stock, ETF, or index fails to break out of a tight consolidation, it traps the bulls who bought the consolidation because they are forced to sell. The weakness subsequently attracts the short sellers, which causes downside momentum to pick up. For that reason, failed breakouts to new highs are consistently one of our favorite and most profitable types of short setups. The ticker symbols of a few retail ETFs to check out are: IYC, RTH, PMR, and XRT.
On the bullish side, the Dow Jones Utilities Average ($DJU) just broke out to a new record high:
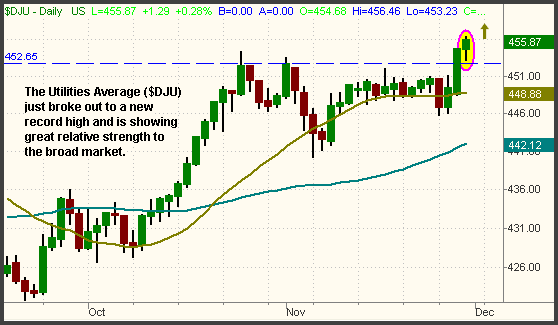
The Utilities sector is showing great relative strength by ignoring the trend of the broad market. If you feel the need to be long anything other than commodities such as oil and gold right now, the Utilities are probably one of your best bets. The S&P Select Utilities SPDR (XLU) and the Utilities HOLDR (UTH) are the two most popular ETFs in the sector. However, all long positions should be entered with reduced position size and tight stops at this moment in time.
Although the S&P has recovered the vicinity of its prior high, the Dow Jones Industrial Average merely kissed resistance of its prior uptrend line yesterday. Prior support becomes new resistance after the support is broken, so this trendline could provide a good excuse for the Dow to move lower in the coming days. This is illustrated on the daily chart of the Dow below:
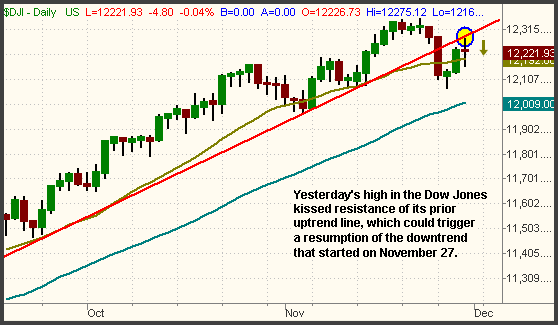
We remain long the UltraShort Dow 30 ProShares, which has a completely inverse chart as the Dow. If the Dow follows through to the downside, this trade will work out well, but our risk is minimal if it doesn't because we have raised our stop to just below breakeven.
The Dow looks the best of the broad-based ETFs on the short side, as it has been showing the most relative weakness and remains below its prior uptrend line. However, we are still of the opinion that a much better bet is to focus on industry sectors that are trading largely independently of the broad market. Banking and Retail are two of the better looking sectors on the short side. Per yesterday's newsletter, we are now short the Regional Bank HOLDR (RKH). Utilities and Energy are showing the most strength on the upside. We locked in nearly a 6-point gain on our OIH position yesterday, but oil may still have some juice left. The same goes for our gold position (GLD), which now has a very tight stop and is near our price target.
Deron Wagner is the Founder and Head Trader of both Morpheus Capital LP, a U.S. hedge fund, and Morpheus Trading Group, a trader education firm launched in 2001 that provides daily technical analysis of the leading ETFs and stocks. For a free trial to the full version of The Wagner Daily or to learn about Wagner's other services, visit MorpheusTrading.com or send an e-mail to deron@morpheustrading.com.


 Free Festival of Traders Videos