Traders returned from the holiday weekend in a bearish mood, sending the stock market sharply lower yesterday. The major indices gapped down slightly on the open, then fell into steady intraday downtrends before finishing at their intraday lows. The Nasdaq Composite plummeted 2.2%, the S&P 500 1.4%, and the Dow Jones Industrial Average 1.3%. Small cap stocks were hardest hit, as the Russell 2000 Index suffered a 2.6% loss. The S&P Midcap 400 slid 2.0%. The indices that rallied the most in recent weeks, the Nasdaq and Russell, were the same ones that fell the hardest yesterday.
Turnover obviously surged well above the previous day's shortened session. In the NYSE, total volume was 212% higher than the prior day's level, while volume in the Nasdaq increased by 198%. Given that the stock market closed three hours early the previous day, the change in volume is not an accurate representation of what really occurred. However, volume in both exchanges rose back above average levels. It was the first time within the past six trading sessions that volume in the Nasdaq came in above its 50-day average level. It's been five days since the NYSE volume exceeded its average of 1.57 billion shares. Market internals were the worst we have seen in quite some time. Declining volume in the Nasdaq exceeded advancing volume by a whopping margin of nearly 12 to 1! The NYSE ratio was negative by just under 8 to 1. At the end of last week, we warned that the stock market had registered nominal gains over several consecutive days, but did so on declining and lower than average volume each time. When this occurs, it only takes one day of institutional selling to wipe out many days of gains, which is exactly what happened yesterday.
Because broad market volatility had dried up, our daily commentary and analysis over the past week has focused primarily on individual sector action rather than support and resistance levels of the major indices. But let's take an updated look at the technical picture of the S&P and Nasdaq because yesterday's selloff resulted in significant changes on a technical level. Perhaps the most notable event was that the S&P 500 closed below support of its primary uptrend line that had been in place since the low of July 18. This also coincided with a break of its 20-day moving average. The break of support is illustrated on the daily chart of the S&P 500 below:
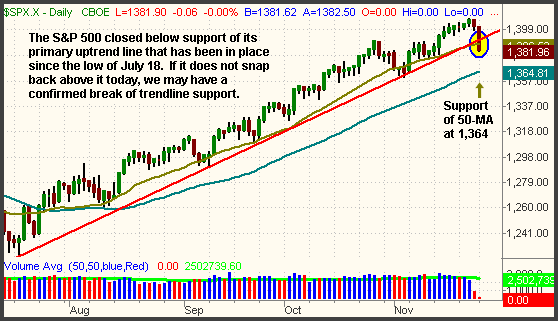
A one-day break of trendline support does not necessitate automatic cause for alarm, as stocks and indexes often snap back above their trendlines in the following session. If the index closes back above its uptrend line today, it will be a bullish sign that indicates yesterday's break of support was a "stop hunt" to shake out the "weak hands" before going higher. If, however, the S&P closes today near or below yesterday's low, we are likely looking at a genuine break of support. In that case, we would anticipate a move down to key support of the 50-day moving average (at 1,364) before expecting any major bullish reversal attempt. The 20-day moving average, which has converged with the prior uptrend line, should now act as resistance. Any weak rally attempt up to the 20-day MA could be treated as a chance to sell long positions into strength and/or "dip a toe in the water" on the short side.
Like the S&P, the Dow Jones Industrial Average also closed below support of its primary uptrend line and 20-day moving average:
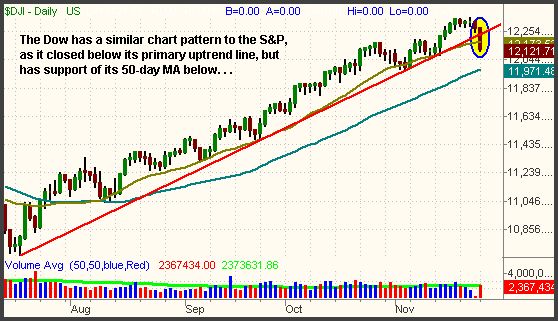
Again, the 20-day moving average and prior uptrend line will both act as new resistance, while the 50-day moving average is a major support level. If the Dow doesn't immediately snap back above its trendline today, look for a move down to the 50-day MA before going much higher. As regular subscribers already know, we sold short the Dow yesterday when it fell below last Friday's low. We did so through buying the Ultra Short Dow 30 ProShares (DXD), which is inversely correlated to the price movement of the Dow Jones, and leveraged at 2 to 1. So far, the trade is showing a marked to market gain of 2.0%, but we expect this to be a short-term, momentum-driven trade.
Although the Nasdaq lost a greater percentage than both the S&P and Dow, it is the only one of the three indices that did not close below its primary uptrend line. This is because it showed the most relative strength when stocks were going up. Its 20-day moving average is presently at the 2,402 level, but its primary uptrend line is a bit further below that. The Nasdaq could fall a bit more and still remain within the confines of its uptrend channel:

While the popular financial media outlets were struggling to find a reason to explain yesterday's selloff, the most accurate and simple explanation is that we merely saw a technical correction from "overbought" conditions. We use the term "overbought" very loosely because stocks can remain in a parabolic state for much longer than one would ever expect. Nevertheless, stocks and indexes never go straight up for an extended period of time without experiencing normal and healthy corrections along the way. So far, we can only say that yesterday's weakness was an overdue reality check to remind investors and traders of the normal cycles of the stock market. If we think it subsequently becomes anything more than that, we'll be sure to let you know. Remember to always trade what you see, not what you think.
Deron Wagner is the Founder and Head Trader of both Morpheus Capital LP, a U.S. hedge fund, and Morpheus Trading Group, a trader education firm launched in 2001 that provides daily technical analysis of the leading ETFs and stocks. For a free trial to the full version of The Wagner Daily or to learn about Wagner's other services, visit MorpheusTrading.com or send an e-mail to deron@morpheustrading.com.


 Free Festival of Traders Videos