Yesterday was a rather uneventful day for the major indices, as the broad market traded in a very tight, sideways range throughout the entire session before finishing a tad higher. The S&P 500 gained 0.2% and the Nasdaq Composite 0.1%, but the Dow Jones Industrial Average was unchanged. Both the small-cap Russell 2000 and S&P Midcap 400 indices advanced 0.2%. It was an "inside day" for both the S&P and Nasdaq, meaning that their intraday highs and lows were both within their respective trading ranges of the prior day's session. Volatility contracted greatly yesterday, as the S&P crawled along in a extremely narrow trading range of only 3.5 points. Since the range has been pretty tight for the past four days, be prepared for an inevitable volatility expansion soon.
Volume patterns were about as interesting as the broad market action. In the NYSE, total volume increased by 1%, but volume in the Nasdaq was 1% lower than the previous day's level. Turnover in both exchanges remained below average levels, which is common when volatility dries up. In the NYSE, advancing volume exceeded declining volume by 1.6 to 1. The Nasdaq ratio was barely positive.
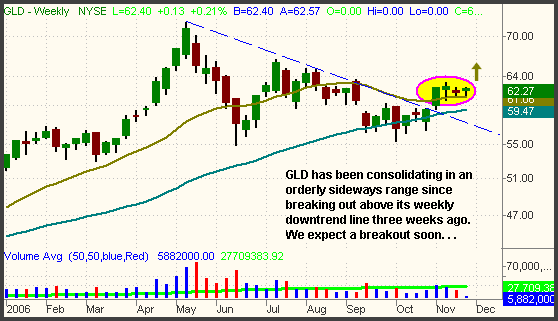
One of the top performing sectors yesterday was the CBOE Gold Index ($GOX), which zoomed 4.3% higher. Our long position in the StreetTRACKS Gold Trust (GLD) only moved 0.8% higher, but the spot gold commodity also held up better than the gold stocks during the recent correction. We continue to like the chart pattern in GLD, which we began buying on October 25. After a brief shakeout on November 8, which we used as an opportunity to add to our position, GLD immediately snapped back and closed at a new multi-month high the following day. Since then, it has been consolidating in a tight, sideways range, enabling its 20-day moving average to rise up and provide support below. Looking at the weekly chart of GLD below, notice how well it has been acting since breaking out above its primary downtrend line three weeks ago:

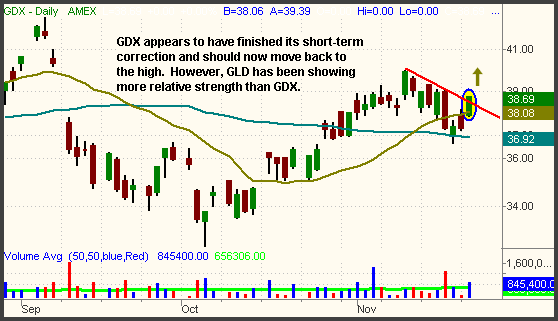
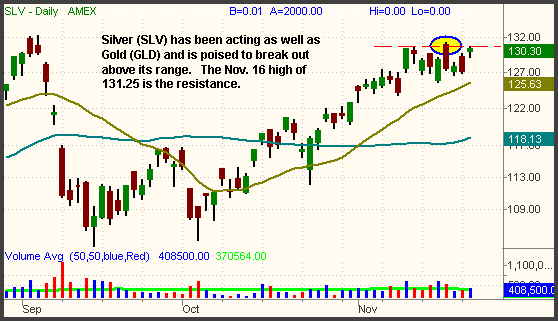
We expect GLD to break out above its November 9 high within the next several days. When it does, momentum should carry it several points higher, at which point we plan to sell our position into strength. In addition to GLD, you may find opportunities in two other mining-related ETFs: the Market Vectors Gold Miners (GDX) and the iShares Silver Trust (SLV). GDX is comprised of a basket of gold mining stocks, while SLV mirrors the price of 10 ounces of the spot silver commodity. Below are daily charts of both:


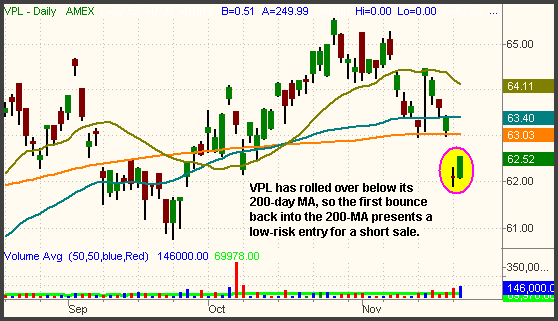
Over the past several weeks, the Japanese Nikkei 225 Index has been showing major weakness. As such, international ETFs correlated to the Japanese markets have sustained losses as well. Both the iShares Japan (EWJ) and the Vanguard Pacific (VPL) have broken major support levels and are setting up for potential short sales on the next bounce into resistance. Of the two, we like the chart pattern and volatility of VPL better. On its daily chart below, notice how it failed its October 26 breakout, rolled over, then fell below its 200-day moving average only two days ago:

Prior support of its 200-day moving average should now act as the new resistance level. As such, we like the idea of selling short VPL on any rally attempt into its 200-day moving average. Such an entry would provide you with a positive risk/reward ratio because you could place your protective stop just above the 20-day moving average (presently at 64.11). Assuming VPL fizzles out and heads back down, the first level of support would be found at the September 25 low of 60.79. Beyond that, it could drop rather far before finding any significant price support. In the event that VPL moves lower from here without bouncing first, be sure to reduce your share size in order to minimize the risk of a less ideal entry point.
NOTE: The U.S. markets will be closed this Thursday, November 23, in observance of the Thanksgiving Day holiday. On Friday, November 24, the stock market will close early at 1:00 pm EST. As such, The Wagner Daily will not be published this Thursday, but regular publication will resume on Friday.