The broad market broke its three-day winning streak yesterday, as firmly higher volume pointed to institutional selling into strength. The Nasdaq Composite lost 0.4%, the S&P 500 0.5%, and the Dow Jones Industrial Average 0.6%. Small caps led the way lower, as the Russell 2000 Index slid 0.9%. The S&P Midcap 400 was off by 0.6%. In the previous session, stocks gapped down on the open, then reversed and trended higher in the afternoon. Yesterday's action was the opposite. Each of the major indices finished near their intraday lows. The Dow slid below the previous day's low, while the S&P 500 closed right at it.
Total volume in the NYSE surged 10% higher, while volume in the Nasdaq was 13% higher than the previous day's level. The broad-based losses on higher turnover caused both the S&P and Nasdaq to register bearish "distribution days." Although stocks rose in higher volume in each of the two preceding sessions, significantly more shares traded hands yesterday than in either of the "accumulation days." The 2.45 billion shares traded in the Nasdaq was the highest since September 15. Obviously, it was negative that such a spike in volume occurred on a down day. Yesterday was the fourth "distribution day" in the Nasdaq within the past month, while it was the third such day of institutional selling in the NYSE. Healthy markets can typically digest two to three days of higher volume selling within such a period, but it is definitely a warning sign to the bulls when the rolling count of "distribution days" exceeds four days within a four week period. Remember that volume is always the footprint of institutional activity that shows what is really happening "under the hood" of the market. Since institutional trading activity accounts for more than half of the market's turnover on any given day, the stock market always follows the lead of mutual funds, hedge funds, pension funds, and other institutions. That's why we pay so much attention to the daily relationship between the market's price and volume.
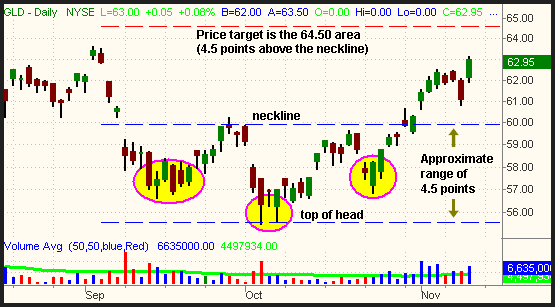
One sector that completely ignored the market by rocketing 5.0% higher was the CBOE Gold Index ($GOX). Participating in the fun was the StreetTRACKS Gold Trust (GLD), which zoomed 3.0%. Fortunately, our timing to add shares of GLD on the pullback to the 10-day MA the previous day worked out very well. An overnight rally in the spot gold commodity caused GLD to open yesterday at the top of the previous day's range, instantly trapping the bears who attempted to sell the correction. This, in turn, attracted the momentum buyers who promptly pushed spot gold (and GLD) to a new multi-month high. Based on the bullish inverse "head and shoulders" pattern, our original reason for buying GLD, the upside price target for GLD is the 64.50 area. With any "head and shoulders" pattern, the projected move is equal to the distance from the top of the head down to the neckline. In this case, that equates to a move of just over 4.5 points above the neckline at the $60 area. If GLD gaps up significantly on today's open, we will probably sell the position into strength because it is nearing our profit target. The daily chart of GLD below shows the projected move based on the inverse "head and shoulders" pattern (moving averages removed for simplicity of seeing the chart pattern):

As anticipated, our long position in the U.S. Oil Fund (USO) gapped up above its downtrend line yesterday morning, then rallied to close the session 2.1% higher. We remain long and will soon trail our stop higher to lock in gains. The Oil Service HOLDR (OIH) traded through our initial price target of 142.10 yesterday, but we sent an intraday e-mail alert announcing we were raising the target a few points due to its positive price action. It subsequently dropped back down below our original target of 142.10 in the afternoon, but found support at the previous day's high. We have raised the stop to 138.70 to lock in nearly a seven-point gain, and will continue trailing it higher as we are able.
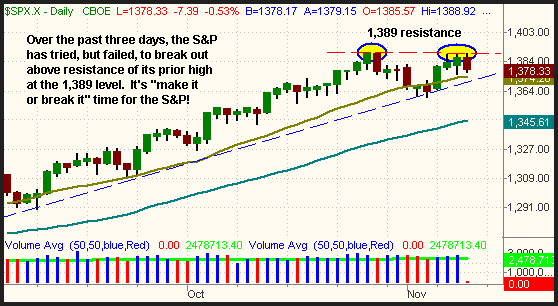
The S&P 500 and Nasdaq Composite are facing the moment of truth as to whether they resume their impressive uptrends or enter into an intermediate-term correction. Take a look at the daily chart of the S&P 500:

On October 27, a short-term correction began that caused the S&P 500 to fall to support of the lower channel of its uptrend line five days later. On November 6, the index did as it was "supposed" to do by bouncing off support of that trend line, then grinding higher to test its resistance at 1,389 on November 7 and 8 before selling off yesterday. The end result of this action is that the S&P 500 is now at a "make it or break it" level. Over the next few days, the index will either blow off yesterday's distribution and rally above the prior high at 1,389 or it will break firmly below its primary uptrend line. If the index breaks out to the upside, there is an absolute lack of overhead supply to content with, so stocks could move much higher in that scenario. Conversely, a confirmed close below the uptrend line would likely send the S&P 500 at least down to support of its 50-day moving average, presently at the 1,345 level.
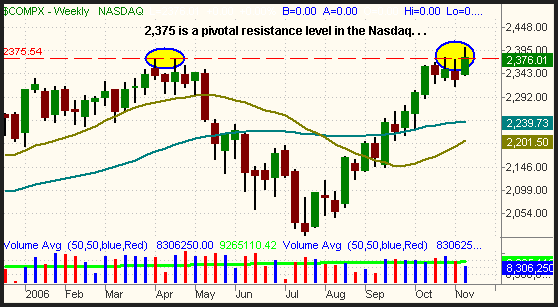
For the Nasdaq Composite, we'll look at the longer-term weekly chart. Unlike the S&P 500, which is trading in the range of a new 52-week high, the Nasdaq is still struggling with resistance of its prior highs from April:

In April, the Nasdaq stalled at the 2,375 level on two separate occasions before entering into a three-month downtrend. The prior intraday highs at 2,375 therefore became the 52-week high that the Nasdaq has been fighting to overcome this week. On November 7, the Nasdaq probed above the 2,375 level on an intraday basis, but closed below it. The index closed at 2,384 the following day, November 8, but yesterday's failed gap above the range caused the Nasdaq to finish the session at 2,376, basically right at that pivotal 2,375 level. It's pretty clear that 2,375 has become a very pivotal level for the Nasdaq. The way we see it is that the Nasdaq needs to convincingly break out to a fresh 52-week high by closing firmly above resistance at 2,375 very soon, or else the bulls will throw in the towel. If the latter occurs, expect the index to rapidly move down to support of its prior low of 2,316 that was set on November 3. Beyond that, support of the 50-day MA is presently at 2,287.
The market has been giving a lot of mixed signals that make it difficult to predict whether the S&P and Nasdaq break out to new highs or move down to their prior lows. Many sectors and leading stocks have had both false breakouts and breakdowns, and the market has been showing a mix of accumulation and distribution as well. The outcome, however, doesn't matter to us either way because our goal is not to predict which way the market will go. Rather, our job is to be thoroughly prepared to react and profit from moves in either direction. We're satisfied with our current mix of open ETF positions, as oil, and especially gold, both trade largely independently of the stock market.
Deron Wagner is the Founder and Head Trader of both Morpheus Capital LP, a U.S. hedge fund, and Morpheus Trading Group, a trader education firm launched in 2001 that provides daily technical analysis of the leading ETFs and stocks. For a free trial to the full version of The Wagner Daily or to learn about Wagner's other services, visit MorpheusTrading.com or send an e-mail to deron@morpheustrading.com.