The major indices shot higher out of the starting gate yesterday morning, then drifted sideways to slightly lower throughout the afternoon before finishing with temperate gains. The Dow Jones Industrial Average brushed off last Friday's ephemeral correction and surged 1% higher, again closing at a fresh record high. The Nasdaq Composite and S&P 500 both gained 0.6%, with the latter registering a new five and a half year high. The S&P Midcap 400 rallied 0.5%, but the small-cap Russell 2000 showed relative weakness again by advancing only 0.2%. The S&P and Dow both closed at their intraday highs, but the lagging Nasdaq finished near the middle of its range. The Russell diverged by concluding the session near its intraday low. Notably, investors and traders have largely been ignoring small-cap stocks for the past two days. The StreetTRACKS Gold Trust (GLD), which we highlighted as a potential breakout above its five-month downtrend line, fell 1.9% yesterday. No harm done though, as it never approached our trigger price for long entry.
Although yesterday's gains were decent, they occurred on lighter volume. Total volume in the NYSE was 5% lower than the previous day's level, while volume in the Nasdaq tapered off by 2%. Obviously, it would have been better if the rally was confirmed by higher turnover. The Nasdaq has crept higher in each of the past three sessions, but each advance has been on declining volume. Just as their chart patterns are better than the Nasdaq, the volume patterns of the S&P and Dow have also been healthier. After nearly going negative ninety minutes before the close, market internals finished moderately positive. In the Nasdaq, advancing volume exceeded declining volume by a margin of 1.8 to 1. The NYSE ratio was positive by 2 to 1.
The Semiconductor Index ($SOX) gained 0.5% yesterday, but remains stuck just below its 50-day moving average. As discussed thoroughly in yesterday's commentary, keep a close eye on the key support at the 444 level in the coming days. If that level is broken, it would weigh heavily on the Nasdaq, and correspondingly the broad market. Conversely, the $SOX could form a double bottom and reverse back up to its high. In order to have a chance at doing so, the $SOX would need to rally above resistance of both the three-day high and the 20-day MA, presently at the 457 level.
When the U.S. markets are strong, it usually pulls the international markets along with it, and the current rally has not been an exception. A quick glance at this week's ETF shows that each and every international ETF we track is currently in an ascending trend. The most recent international ETF we discussed was the Vanguard Emerging Markets ETF (VWO), which we pointed out after spotting a huge volume spike on October 16. Since then, VWO has been consolidating near the high of its recent breakout and looks good for further gains. Before that, in the October 5 column, we brought to your attention the breakout to a new record high in the iShares Xinhua China 25 Fund (FXI). FXI has acted great over the past two weeks, trending steadily higher and gaining nearly 3% since its October 4 breakout. In doing our nightly scanning, we came across what may be the next international ETF to break out of a long consolidation. Take a look at the daily chart of the iShares Hong Kong Fund (EWH):
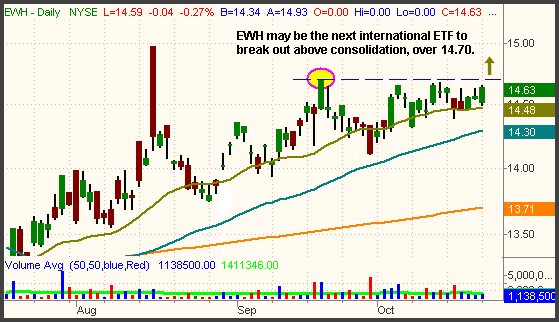
First of all, disregard the big red bar on August 16. It was caused by a cingular rogue trade that went off way above the offer price in the first minute of trading that day. Occasionally, that happens with both stocks and ETFs whenever an overzealous trader bids too high above the market on an ECN (such as ARCA) right on the open. Anyway, as you can see, EWH has been consolidating in a tight range near its high for the past month. The pivotal breakout level is the September 20 high of 14.70, illustrated by the dashed horizontal line. Since EWH closed just a few pennies below its pivot yesterday, there is a good chance it will test that breakout level within the next one to two days. Although the setup is solid, you might consider reducing your share size if you buy EWH on the breakout. The U.S. markets are, of course, quite strong, but the major indices remain glued to the upper channel resistance of their uptrend lines. A normal correction down to lower channel support could cause the EWH breakout to fail. The danger of buying breakouts at this stage is that they are basically out of sync with the market because most of the leading stocks and ETFs have already broken out.
Obviously, the market has been strong and remains in a steady uptrend. Overall odds continue to favor the long side of the market, but the problem is that nearly every ETF is now extended pretty far away from support. This creates a negative risk/reward ratio for new long entries right now. If you're not already long, there are basically two options that make sense. The first is to sit on your hands and do nothing ("SOH mode") until low-risk long entries present themselves again. The second option is to be prepared for capturing short-term downside momentum of an imminent correction, but that is only recommended for advanced traders. If the market does retrace from here, look for the semiconductor and small-cap sectors to lead the way lower.
Tomorrow, the Federal Reserve Board meets to discuss interest rates. Virtually nobody expects a change in rates, so this meeting may be more of a non-event than others over the past year. Still, we don't expect investors or traders to throw a lot of capital at the markets until after tomorrow afternoon. If volume dries up ahead of tomorrow's meeting, be prepared for the choppy and indecisive trading that generally accompanies it.
Deron Wagner is the Founder and Head Trader of both Morpheus Capital LP, a U.S. hedge fund, and Morpheus Trading Group, a trader education firm launched in 2001 that provides daily technical analysis of the leading ETFs and stocks. For a free trial to the full version of The Wagner Daily or to learn about Wagner's other services, visit MorpheusTrading.com or send an e-mail to deron@morpheustrading.com.


 Free Festival of Traders Videos