Stocks reversed opening weakness and moved into the plus column later in the morning, but the rally ran out of gas around 1:00 pm EDT, causing the market to drift lower throughout the remainder of the session. The major indices were mixed yesterday, although the financial media focused only on the fact that the Dow Jones Industrial Average gained 0.5% and finished at a new all-time high. The Nasdaq recovered from a 0.5% intraday loss to close 0.3% higher and the S&P 500 similarly gained 0.2%, but the gains in the three most popular market indices distorted the relative weakness in the small and mid-cap arena that prevented many leading stocks from making headway. The Russell 2000 fell 0.1%, while the S&P Midcap 400 lost 0.3%. This divergence is important to note because the Russell and S&P Midcap indices usually outpace the other indices on strong days of broad-based buying.
Total volume in the NYSE surged 23% higher yesterday, as volume in the Nasdaq came in 8% above the previous day's level. The S&P 500 and Nasdaq's gains on higher volume technically enabled both indices to register "accumulation days" yesterday, but unimpressive market internals, along with the weakness in leading stocks, failed to confirm the bullishness. In both exchanges, advancing volume exceeded declining volume by only a fractional margin of 1.1 to 1. Generally, we like to see a positive ratio of at least 2 to 1 in order to confirm the strength of "up" days in the broad market.
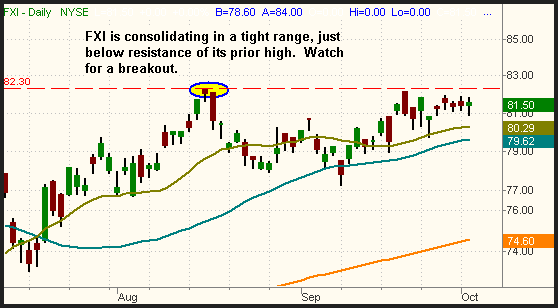
A few weeks ago, we discussed a few of the international ETFs that were acting well. Of those, the one that still has the best chart pattern is the iShares Xinhua China 25 (FXI). This ETF, which tracks mainland China's equivalent of the Dow, is still consolidating near its high, but looks even better now because the range has tightened up. Also, the longer a base of consolidation forms, the more likely that a subsequent breakout will hold up. As the chart below illustrates, a breakout above the 82.30 level in FXI would be quite bullish:

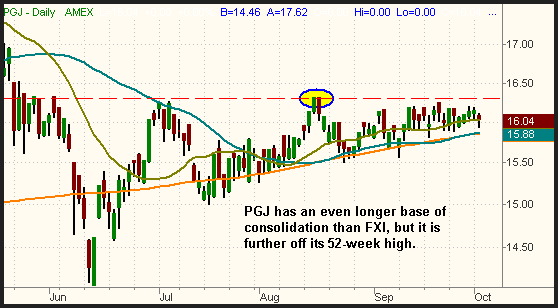
The PowerShares Golden Dragon China Index (PGJ) is another ETF that tracks mainland Chinese companies. Like FXI, it too has been consolidating in a narrow range, but it is much further off its May 2006 high. Nevertheless, a breakout above the high of the horizontal price resistance illustrated below would present a rather low-risk buying opportunity:

Check out the 200-day moving average (the orange line) on the chart of PGJ above. It is another clear example of how the 200-day MA always acts as a major area of support or resistance. We discussed this yesterday regarding how the iShares DJ Transportation (IYT) was consolidating just below the brick wall of its 200-day MA. With PGJ, it is the opposite situation, as the pivotal moving average has been pushing the price higher over the past several months. Notice how the 50-day MA has also perfectly converged with the 200-MA, another factor that should help to eventually lead to a nice breakout.
It's true that the Dow managed to close yesterday at a fresh all-time high, a few points above its January 2000 high, but don't be deceived. Because the index is a popular gauge of the general public's market sentiment, it is often discussed as a barometer of the market's general health, but it's important to realize that the other indices remain well below their record highs. The S&P 500 is still 14% off its March 2000 high, while we may never even live to see the Nasdaq recover back to its all-time high over the 5,000 level. The lagging index is still a whopping 56% off its March 2000 high. While it may be fun and exciting to talk about the merits of the Dow being at a record high, we're simply cautioning you against distorting the reality of the "big picture." History has shown that isolated rallies in the Dow are typically short-lived when the other indices are not in sync. Therefore, unless we suddenly start to see a lot of upward momentum in the Nasdaq, we believe your best bet is to remain positioned on both sides of the market by simultaneously being long the sectors with relative strength and short those with relative weakness.
Deron Wagner is the Founder and Head Trader of both Morpheus Capital LP, a U.S. hedge fund, and Morpheus Trading Group, a trader education firm launched in 2001 that provides daily technical analysis of the leading ETFs and stocks. For a free trial to the full version of The Wagner Daily or to learn about Wagner's other services, visit MorpheusTrading.com or send an e-mail to deron@morpheustrading.com.