The major indices kicked off the third quarter on a negative note, as stocks closed lower across the board. After beginning the day relatively flat, the broad market rallied into positive territory in the late morning, but an early afternoon selloff forced stocks below their morning lows. The Nasdaq Composite fell 0.9%, the S&P 500 0.3%, and the Dow Jones Industrial Average 0.1%. The Dow tried and failed to break out to a new all-time high for the fourth day in a row. The small-cap Russell 2000 declined 0.9%, while the S&P Midcap 400 lost 0.5%. Like the previous day, each of the major indices finished near their intraday lows.
Although stocks have posted losses over the past two sessions, they did so on lighter volume both days. Total volume in the NYSE was 5% lower than the previous day's level, while volume in the Nasdaq decreased by 2%. Turnover picked up during the early afternoon selloff, increasing the morning's overly light levels, but the increase was still not enough to register a bearish "distribution day." So far, the recent correction has been rather orderly and has not shown any signs of institutional investors dumping shares. Market internals were negative, but not by an extremely wide margin. In the NYSE, declining volume exceeded advancing volume by just over 3 to 2. The Nasdaq was ratio by a little more than 5 to 2.
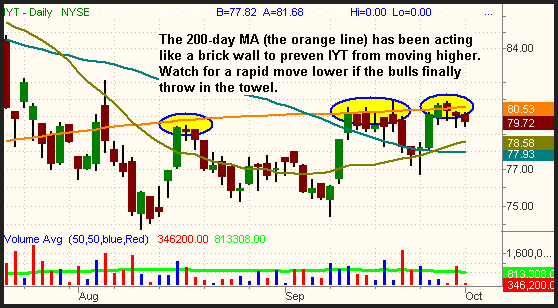
We often discuss the power of the 200-day moving average as a major area of support or resistance for an index, stock, or ETF, and the iShares DJ Transportation Average (IYT) has become a good example of such. IYT formed a double top at its 52-week high at the beginning of July, then reversed to the downside with a 17% loss in the seven consecutive "down" weeks that followed. Since forming its low on August 11, IYT has been trading in a sideways range, with its consolidation having tightened up over the past few weeks. As the daily chart below illustrates, IYT has tried to break out above its 200-day moving average about ten times since forming its August low, but the pivotal area of resistance has acted like a brick wall each time:

If IYT manages to firmly close above its 200-day MA, it will likely see at least a short-term, momentum driven pop to the upside. This is what happened to the Biotech HOLDR (BBH) when it busted out above its 200-MA four days ago. However, it is important to realize that each successive failed attempt to break out above its 200-day MA weakens the resolve of the bulls. If the buyers eventually throw in the towel, it will attract the interest of the short sellers who have been focused on that 200-MA. Such a chain of events would lead to a selloff that would force IYT down to at least its prior low. We think a break of the four-day low can be sold short, especially if higher than average volume confirms the selloff. If you initiate such a play, be sure to keep a firm stop above the 200-day moving average to protect against a failed breakdown. With a stop just above the 200-MA, you would also be looking at a very positive risk/reward ratio on the setup.
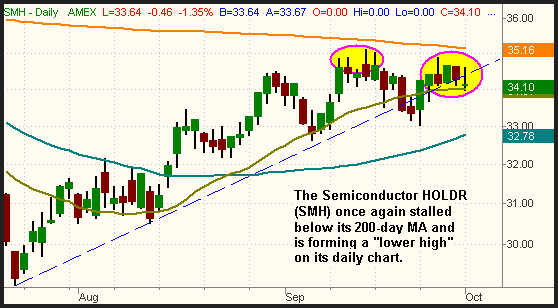
The Semiconductor Index ($SOX), a heavily weighted component of the Nasdaq, appears to be in the process of rolling over. On September 22, the index closed below support of its two-month uptrend line, but snapped back above it the following day. On September 27, it attempted to test its prior highs from the middle of September, but looming overhead resistance of the 200-day MA caused a bit of trepidation on the part of buyers. As such, the $SOX appears to have set a "lower high" over the past few days and has been showing relative weakness to the broad market. The Semiconductor HOLDR (SMH), which is poised to fall below its 20-day MA, has a very similar chart pattern:

Because we remain short the Semiconductor HOLDR (SMH), we continue to believe the $SOX will break back down below its primary uptrend line and at least test support of its 50-day moving average. If it does, this is a major negative for the broad market because the $SOX typically leads the Nasdaq, which often leads the S&P and Dow. Negative earnings guidance from Semiconductor stock Marvell Technology after yesterday's close will likely weigh on the $SOX index today as well.
Deron Wagner is the Founder and Head Trader of both Morpheus Capital LP, a U.S. hedge fund, and Morpheus Trading Group, a trader education firm launched in 2001 that provides daily technical analysis of the leading ETFs and stocks. For a free trial to the full version of The Wagner Daily or to learn about Wagner's other services, visit MorpheusTrading.com or send an e-mail to deron@morpheustrading.com.