For the second consecutive day, the S&P 500 attempted to break out to a new 52-week high, but failed to register anything more than an intraday probe above resistance. The bears took control of the indecision this time, causing stocks to trend lower throughout the afternoon and finish with losses across the board. The Nasdaq Composite, S&P Midcap 400, and the Dow Jones Industrial Average each slid 0.7%, while the S&P 500 fell 0.5%. The small-cap Russell 2000 lost 1.0%. Each of the major indices gave up most or all of their previous day's gains and finished near their intraday lows.
Total volume in the NYSE was 5% higher, but volume in the Nasdaq was 9% lighter than the previous day's level. The mixed turnover caused the S&P to register a bearish "distribution day," while the Nasdaq dodged one. Part of the reason for the divergence in volume was likely attributed to the massive number of shares that traded hands in the retail drug store stocks, each of which plummeted after news that Wal-Mart would begin selling generic pharmaceuticals for a mere four dollars. The volume surge on the handful of drug store stocks accounted for more than 100 million shares above average levels. This alone resulted in the NYSE volume being approximately 6% greater. Nevertheless, market internals in both exchanges were still negative. In the Nasdaq, declining volume exceeded advancing volume by a margin of just over 2 to 1, while the NYSE ratio was negative by just under 2 to 1.
In yesterday's newsletter, we illustrated how the S&P 500 was facing a "moment of truth" due to pivotal resistance of its 52-week high. In Wednesday's session, the index briefly traded above its 52-week high of 1,326, but closed fractionally below it. The S&P again traded above the 1,326 resistance level yesterday morning, but the rally attempt fizzled out. Worse is that the index gave back all of the previous day's gain and closed 0.6% below the pivotal breakout level. While it is still a bit too early to declare an official failed breakout in the S&P 500, it is certainly setting up to become one. One major problem over the past few days has been the sudden relative weakness in the Semiconductor Index ($SOX).
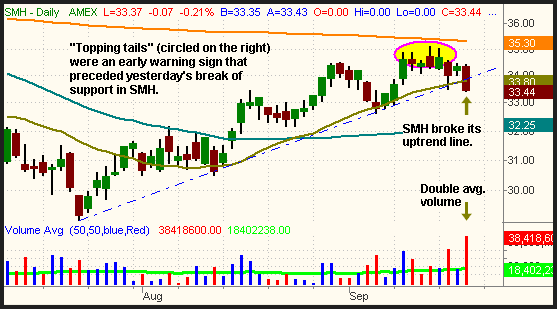
The $SOX index has led the broad market's recovery since the lows that were set in July, but the semis have entered into a corrective phase that has resulted in relative weakness for the sector. As we pointed out a few days ago, the first sign of weakness in the $SOX occurred when the index formed a bearish "inverted hammer" candlestick pattern on September 15, which occurred with resistance of the 200-day moving average just overhead. When an "inverted hammer" forms at the high of an extended rally, it often marks at least a short-term top in the stock or index. As such, we sold short the Semiconductor HOLDR (SMH) the following day and still remain short. Since then, it has shown relative weakness to both the S&P and Nasdaq by posting smaller gains on the "up" days and losing more than the major indices on the "down" days. On a technical level, it is also important to note that SMH closed yesterday below support of its primary uptrend line that has been in place since the low of July 21. It also finished firmly below its 20-day MA for the first time since the current uptrend began. Further, it broke down on more than double its average daily volume, a sign that institutions were dumping semiconductor shares into strength. Looking at the chart of SMH below, notice also how the "topping tails" at its recent high (circled in pink) preceded yesterday's break of trendline support:

Never underestimate the importance of strength or weakness in the $SOX index. Because the semiconductor stocks are so heavily weighted, the Nasdaq tends to follow the direction of the $SOX. In turn, the S&P and Dow often follow the direction of the Nasdaq. Therefore, it's a fair generalization to say that the $SOX index leads the broad market. It was the bullish reversal in the $SOX in mid-July that triggered buying interest off the broad market's lows. Obviously, this means that a sudden change in bias in the semiconductor stocks could just as easily deflate the market. Resistance of the 52-week high in the S&P gives another good excuse for traders to sell shares right now. Remember that trading can often be quite volatile and erratic when an index is testing a 52-week high, so be alert and honor your stops on both sides of the market.
Deron Wagner is the Founder and Head Trader of both Morpheus Capital LP, a U.S. hedge fund, and Morpheus Trading Group, a trader education firm launched in 2001 that provides daily technical analysis of the leading ETFs and stocks. For a free trial to the full version of The Wagner Daily or to learn about Wagner's other services, visit MorpheusTrading.com or send an e-mail to deron@morpheustrading.com.