As widely expected by economists, the Federal Reserve Board left interest rates unchanged yesterday, enabling the major indices to handily recover their previous day's losses. The Feds indicated that future rate hikes remain a possibility, but are not likely to happen in the near future. The news initially prompted indecision, as stocks sold off immediately after the announcement, but recovered to their prior intraday levels in the final hour. Despite relative weakness in the Semiconductor Index ($SOX), the Nasdaq Composite led the way with a 1.4% gain. The S&P 500 advanced 0.5%, while both the S&P Midcap 400 and Dow Jones Industrial Average rallied 0.6%. The small-cap Russell 2000 gained 1.2%, enabling the index to finish at its highest level since June 6 of this year. Each of the major indices finished in the upper third of their intraday ranges.
Turnover rose across the board, causing both the S&P and Nasdaq to register bullish "accumulation days." Total volume in the NYSE increased by 8%, while volume in the Nasdaq was 4% higher than the previous day's level. NYSE volume moved back above its average level, as the Nasdaq volume remained above its 50-day average for the past seven consecutive sessions. The broad-based gains on higher volume resulted from institutional buying known as "accumulation." Because institutions such as mutual funds, pensions, and hedge funds control more than half of the market's average daily volume, "up" days in the market are typically confirmed when backed by the higher volume that results from institutional participation. Market internals were positive as well. In the Nasdaq, advancing volume exceeded declining volume by a margin of more than 3 to 1, but the NYSE ratio was positive by only 3 to 2. This divergence confirmed yesterday's price divergence between the S&P and Nasdaq as well.
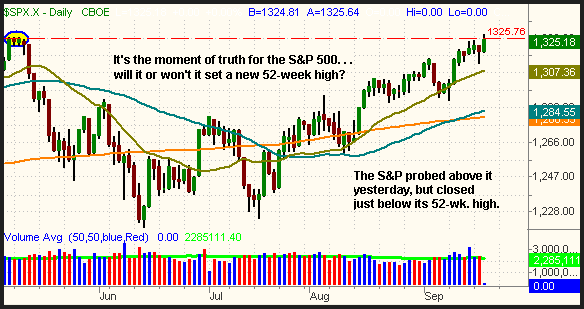
Not surprisingly, the S&P 500 probed above resistance of its 52-week high yesterday, but closed fractionally below it. The 52-week closing high is 1,325.76 and was set on May 5. The prior 52-week intraday high was 1,326.70 and occurred on May 8. Yesterday, the S&P 500 printed an intraday high of 1,328.53, but closed at 1,325.18. The dashed horizontal line on the chart below marks the 52-week closing high of May 5:

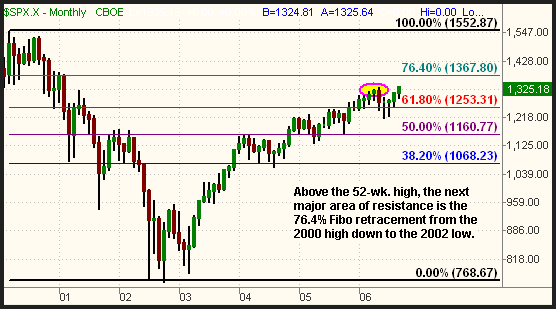
Because of the close proximity to its 52-week high, we mentioned in the beginning of the week that the S&P was likely to test that critical resistance level sometime this week. Obviously, that is what happened yesterday. But now the S&P faces the moment of truth -- will it be able to close and hold above the 1,326 level? If it does, the index will lack overhead supply and, as such, could continue to rally quite a bit further without a significant correction. Above the 52-week high, the 76.4% Fibonacci retracement level from the March 2000 high down to the October 2002 low is the next major area of price resistance. On the long-term monthly chart below, notice that the 76.4% Fibo retracement is at the 1,367 area. We have circled the May 2006 high in pink color:

It's good to have a general upside target if the S&P breaks out to new high territory, but it must first prove it can do so. As we have discussed on numerous occasions recently, failed breakouts to new 52-week highs often result in rapid reversals to the downside. The profitable short short sale trades in both the S&P Select Energy SPDR (XLE) and S&P Select Utilities SPDR (XLU) this month are good examples of such.
If the S&P would have closed yesterday near its intraday low of 1318, it would have already been looking like a failed breakout. However, its recovery in the final hour enabled the index to close right at its pivot. Over the next few days, we will likely see a tug-of-war between the bulls and bears. Be prepared for volatile and erratic trading while the S&P hangs out at this critical level, and be prepared with an action plan for either scenario.
Deron Wagner is the Founder and Head Trader of both Morpheus Capital LP, a U.S. hedge fund, and Morpheus Trading Group, a trader education firm launched in 2001 that provides daily technical analysis of the leading ETFs and stocks. For a free trial to the full version of The Wagner Daily or to learn about Wagner's other services, visit MorpheusTrading.com or send an e-mail to deron@morpheustrading.com.