Continued strength in the tech stocks, especially the semiconductors, helped the Nasdaq score its fifth consecutive day of gains yesterday, although the S&P and Dow lagged behind. The Nasdaq Composite moved modestly higher during the first ninety minutes of trading, then drifted in a sideways range throughout the rest of the session before finishing with a 0.6% gain. The small-cap Russell 2000 again showed relative strength by closing 0.8% higher, but the S&P Midcap 400 only managed to advance 0.2%. Weakness in the energy sector weighed on the S&P 500, which was unchanged. The Dow Jones Industrials eked out a 0.1% gain. Confirming the price divergence, both the S&P and Dow finished near the middle of their intraday ranges, but the Nasdaq closed near its high.
Total volume in the NYSE declined by 6%, but volume in the Nasdaq registered 3% higher than the previous day's level. The modest rise in turnover was enough to give the Nasdaq its third straight "accumulation day" that occurs whenever an index closes higher and on higher volume. Unfortunately, however, it was also the Nasdaq's ninth straight session in which turnover came in below its 50-day average level. Institutions appear to have been nibbling in the tech arena over the past several days, but confirmation will occur if stocks hold their gains when traders begin returning to their desks after the Labor Day holiday this coming Monday. Trading activity should return to normal by the middle of next week, so the direction of the market that coincides with the increased turnover will be critical in determining the overall bias going into the month of September.
If you have been buying stocks and ETFs over the past several weeks, the semiconductors, internets, software, and hardware sectors have clearly been the place to be. The $SOX has followed through as we anticipated last week, but we continue to advise tight trailing stops to protect your gains because the rest of the broad market has not been keeping pace. Sectors ranging from energy to transportation to financials have each been trending sideways to lower while the techs have stealthily moved higher. When major industry groups are out of sync with each other and trading in opposite directions, it usually leads to a lot of chop and indecision in indices such as the S&P 500. This divergence between the tech and non-tech sectors means that you are probably better off avoiding new trade entries in the broad-based ETFs and instead focusing on ETFs that are tied to specific industry sectors. In our hedge fund, for example, we are currently long a few semiconductor stocks, but are simultaneously short several oil stocks and ETFs that have been showing relative weakness to the broad market. Considering that the Semiconductor Index ($SOX) gained 1.8% and the Amex Oil Index ($XOI) fell 1.4% yesterday, this blend of positions has been working well. Our goal is simply to follow the institutional sector rotation that is constantly occurring in all market conditions. We buy sectors with relative strength and sell short those with relative weakness to the broad market. Overlaying charts of the individual sectors with charts of the S&P and Nasdaq is an efficient and simple way to spot these divergent patterns.
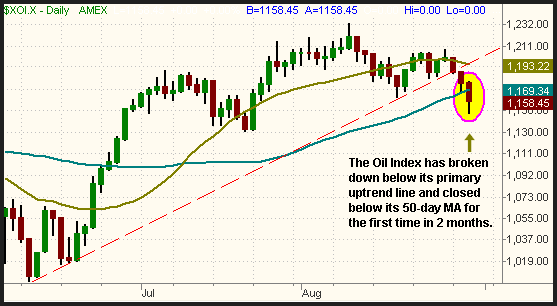
We sold short the oil sector last week when the $XOI index failed to hold its August 9 breakout attempt. As mentioned in the past, failed breakouts to new 52-week highs often present great short-selling opportunities with great risk/reward ratios if your timing is right on the entry. Although we sat through a week of sideways trading action, the $XOI index began to roll over yesterday. For the first time since June 26, the $XOI index closed below its 50-day moving average. The selloff also resulted in a breakdown below support of its two-month uptrend line. This is illustrated on the daily chart of the $XOI index below:

There are numerous families of ETFs that track the Oil Index. The S&P Select Energy SPDR (XLE) and the PowerShares Dynamic Energy (PXE) are two of the more popular ones. Note that the Oil Service HOLDR (OIH) mirrors the Oil Service Index ($OSX), which has a very different chart pattern than the Oil Index.
Deron Wagner is the Founder and Head Trader of both Morpheus Capital LP, a U.S. hedge fund, and Morpheus Trading Group, a trader education firm launched in 2001 that provides daily technical analysis of the leading ETFs and stocks. For a free trial to the full version of The Wagner Daily or to learn about Wagner's other services, visit MorpheusTrading.com or send an e-mail to deron@morpheustrading.com.