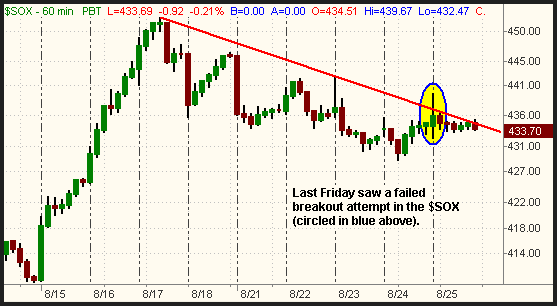
As anticipated, the Semiconductor Index ($SOX) tested resistance of its hourly downtrend line last Friday, but failed to close above it. The $SOX surged higher on the open, but the bears took control less than an hour later, pulling the index back down to where it started. The $SOX subsequently traded in a narrow, sideways range near the unchanged level throughout the remainder of the session. The major indices followed the same pattern. Both the S&P 500 and S&P Midcap 400 indices lost 0.1% and the Dow Jones Industrial Average fell 0.2%, but the Nasdaq Composite showed relative strength by advancing 0.2%. The small-cap Russell 2000 Index similarly eked out a 0.1% gain. Despite a positive close in the Nasdaq, the $SOX was off by 0.2%.
In keeping with the recent trend of the summer doldrums, turnover again declined across the board. Total volume in the NYSE dropped 14%, while volume in the Nasdaq was 9% lighter than the previous day's level. Excluding the holiday-shortened session of July 3, it was the lowest volume day of the year in both exchanges. In the NYSE, advancing volume was about on par with declining volume, but the Nasdaq spread was positive by just over 3 to 2.
In last Friday's newsletter, we discussed the bullish pattern that was setting up on the hourly chart of the $SOX. Not surprisingly, the $SOX probed above its hourly downtrend line and attempted to follow through on the prior week's strength, but the rally attempt fizzled out. Hopefully you heeded our advice to maintain a tight trailing stop on any of the semiconductor ETFs in the likely event of a failed breakout in the $SOX. On the hourly chart below, we circled the opening spike above the downtrend line that failed to hold up:

We cannot accurately declare that momentum in the $SOX is finished, but last Friday's action was certainly not a good sign. After such an orderly retracement off its highs, one would have expected the index to hold firm after its first attempt of a bullish follow-through. But the timing is such that traders have not been overly willing to commit to holding positions in the current environment. Like we mentioned last week, you really need to have a more conservative profit target and a shorter time frame on long positions right now.
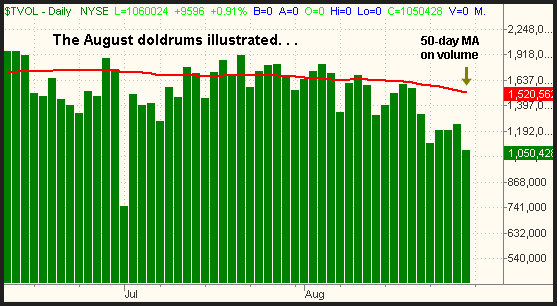
Over the past several weeks, we have been discussing how August is typically a slow month for the markets due to the lack of institutional participation that results from traders taking their annual summer vacations. In determining whether or not volume is at healthy levels, we use a 50-day simple moving average overlayed with a daily bar chart of volume. A one or two day dip below the 50-day average is not a big deal, but turnover in the NYSE has come in below its 50-day average in each of the past twelve sessions. It will likely remain that way until after the Labor Day holiday has passed. The chart below illustrates how we monitor the market's volume on a daily basis. Each green bar represents the total NYSE volume level for one day of trading, while the red line plots the 50-day average volume (simple moving average):

Have you noticed the correlation between the market's numerous choppy, indecisive days over the past week and the very light volume levels? This is a common occurrence. Because institutional trading activity accounts for an estimated 70% of the stock market's daily turnover, participation by the mutual funds, hedge funds, and other heavy hitters is crucial in establishing and maintaining market trends. When institutional participation is lacking, as measured by daily volume levels, the market often trades like a ship without a rudder. Volume should begin to pick up next week, but we don't recommend doing much until then. Instead, focus on managing your existing positions and developing a solid watchlist for both sides of the market. Doing so will enable you to be fully prepared to take advantage of the market's next confirmed move.
Deron Wagner is the Founder and Head Trader of both Morpheus Capital LP, a U.S. hedge fund, and Morpheus Trading Group, a trader education firm launched in 2001 that provides daily technical analysis of the leading ETFs and stocks. For a free trial to the full version of The Wagner Daily or to learn about Wagner's other services, visit MorpheusTrading.com or send an e-mail to deron@morpheustrading.com.