Stocks gapped down on the open yesterday morning, but traded in a tight, sideways range throughout the entire session. The S&P 500 lost 0.4% and the Dow declined 0.3%. The Nasdaq Composite, whose gains outpaced the S&P 500 and Dow Jones Industrials last week, showed relative weakness for the second straight day by falling 0.8%. Small and mid-cap stocks, which are usually an accurate leading indicator for the Nasdaq, closed significantly lower as well. Both the Russell 2000 and the S&P Midcap 400 indices closed 0.9% lower. Traders showed a lack of commitment into the close, which resulted in each of the major indices closing near the middle of their narrow intraday ranges.
Turnover fell for the third consecutive day, although this time the lighter volume was positive. Total volume in the NYSE declined by 16%, while volume in the Nasdaq was 21% lower than the previous day's level. Although the number of shares changing hands was once again below average levels, the losses on lower volume means that institutions were not aggressively selling stocks. Interestingly, volume in both exchanges yesterday was the lightest of any full trading days so far this year. Obviously, a sudden return of institutional trading activity could result in stocks making a swift move in either direction, but we are not likely to see that until after the Labor Day holiday has passed.
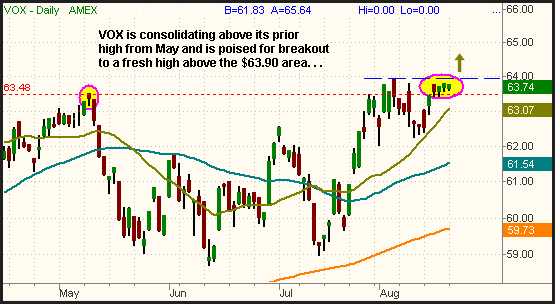
Although each of the major indices and most industry sectors remain well off their 52-week highs, we noticed two ETFs that are consolidating near their all-time highs and are poised for breakouts to fresh highs. They are the Vanguard Telecom Services (VOX) and the Euro Currency Trust (FXE). As the chart below illustrates, VOX has been consolidating at its highs for the past four days, which means it will likely be one of the first ETFs to break out to a new record high when the stock market bounces just a bit. Notice how VOX also closed above its prior high from early May. That prior high should now act as the new support level:

As you may have noticed, VOX trades an average daily volume of only fifty thousand shares. But remember that, unlike individual stocks, all exchange traded funds are synthetic instruments. As such, the amount of average daily volume that an ETF trades is, for the most part, irrelevant. Even if a particular ETF had no buyers or sellers for several hours, the bid and ask prices would continue to move in correlation with the market value of the ETF that is derived from the prices of the underlying stocks. The only thing you need to be aware of is that ETFs with a low average daily volume may sometimes have slightly wider spreads between the bid and ask prices. If this is a concern, you can simply use limit orders, but it really should not matter much unless you are a daytrader who is only looking to gain a few pennies on the trade. The point is that you should not necessarily avoid trading in an ETF just because it has a low average daily volume.
Since forming a double bottom at the $125 level last month, FXE has retraced all the way back up to test its prior high from early June. It may consolidate longer, but we anticipate that FXE will soon attempt to break out to a new high. We are targeting a potential buy in FXE if it rallies above the June 5 intraday high of $129.72:

The broad market broke its five-day winning streak yesterday, but the losses were not significant compared to last week's gains. Looking at yesterday's chart patterns, we observed that the session was an "inside day" for both the S&P and Nasdaq. That means their intraday trading ranges from the lows to the highs was contained completely within the previous day's respective ranges. An "inside day" is often a continuation pattern that leads to a resumption of the primary trend, whichever direction that may be. Since stocks are now in a short-term uptrend, yesterday's action did little to change the overall technical picture of the major indices. However, be on guard for a fast and furious move in either direction if volume suddenly returns to the market. A close below the August 17 low in the S&P 500 (1,292) or the August 18 low in the Nasdaq (2,138) should warrant caution on the long side of the market. Conversely, a firm close above the August 18 high in the S&P (1,302) or August 17 high in the Nasdaq (2,168) would be bullish and would confirm that the bulls still have the upper hand, at least in the near-term.
Deron Wagner is the Founder and Head Trader of both Morpheus Capital LP, a U.S. hedge fund, and Morpheus Trading Group, a trader education firm launched in 2001 that provides daily technical analysis of the leading ETFs and stocks. For a free trial to the full version of The Wagner Daily or to learn about Wagner's other services, visit MorpheusTrading.com or send an e-mail to deron@morpheustrading.com.