The major indices got off to a positive start with decent opening gaps to the upside, but the bears quickly took control and sold into strength, causing stocks to trend lower and close with moderate losses. As we have seen on most of the "down" days in recent months, small and mid-cap stocks fell the most. The Russell 2000 lost 1.3% and the S&P Midcap 400 dropped 1.0%. The Nasdaq Composite and S&P 500 closed lower by 0.8% and 0.4% respectively, but the Dow Jones Industrial Average managed to finish unchanged.
Total volume in the Nasdaq rose by 3% yesterday, but the NYSE volume level was about the same as the previous day. The Nasdaq's loss on higher volume added another "distribution day" to the count. The fact that stocks continue to fall on increasing volume confirms our bearish sentiment on the overall market. Until we begin to see light volume on the "down" days and higher volume on the "up" days, it doesn't make sense to get excited about buying stocks. Keeping track of institutional selling is most useful for detecting market tops in advance of the crowd, but it is also useful for confirming the underlying strength of any broad-based selling when in a solid downtrend. Market internals spent the first half of the day in positive territory, but finished negative. In both exchanges, declining volume exceeded advancing volume by a ratio of 1.7 to 1. This was not too bad, but it's bearish that the internals reversed from being positive earlier in the session.
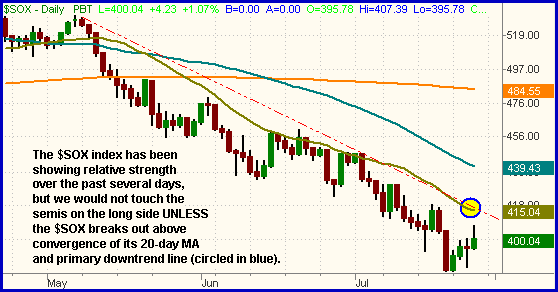
It's interesting to note that yesterday's 0.8% loss in the Nasdaq occurred despite a 1.1% gain in the Semiconductor Index ($SOX). The $SOX finally bounced from oversold conditions and was showing a 3.0% gain at its intraday high, but broad-based selling in the afternoon caused the index to give back most of its gain. The $SOX was one of only three industry sectors that closed in the green yesterday. The other two were the Broker/Dealer Index ($XBD) and the Telecom Index ($XTC), both of which gained the same as the $SOX. Because the semiconductor stocks are so heavily weighted within the Nasdaq, the strength in the $SOX helped mask the true weakness in the Nasdaq, which would have closed much lower if the $SOX had not bounced. The $SOX may be trying to put in at least a short-term bottom, but it still remains below resistance of its primary downtrend line. We would not touch the semis on the long side until the $SOX at least breaks out above its downtrend line. Even then, overall broad market conditions could dictate staying positioned fully on the short side of the market. As you can see on the daily chart of the $SOX below, the primary downtrend line (the dashed red line) converges with the 20-day moving average (the beige line). You may want to keep an eye on that convergence of resistance because a breakout above that level could trigger a lot of short covering and some tradeable momentum on the upside:

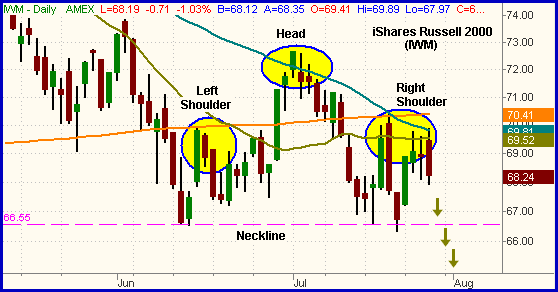
Because they are considered to be more "aggressive" investments than large-cap stocks of established companies, the small and mid-cap stocks tend to lead the broad market in both directions. When in a bull market, the gains in the small and mid-cap indices will usually outpace the gains in the S&P and Nasdaq on the "up" days. Conversely, a conservative "flight to safety" mentality usually causes both sectors to lead the market lower when the stock market is weak. We always pay careful attention to the technical patterns of both the Russell 2000 and S&P Midcap 400 indices because they tend to lead the market in both directions. When studying their charts over the past several days, we noticed that both indexes are in the process of completing the right shoulder of a bearish "head and shoulders" chart pattern. Below, we have illustrated this chart pattern on the daily chart of the iShares Russell 2000 Index (IWM):

On the right shoulder, notice how IWM has formed kind of a double right shoulder by bouncing off the low of July 21. The double right shoulder indicates a bit of resilience because the bulls stepped in when IWM tested support of the neckline both times. It is noteworthy to be aware of this. However, a confirmed break of the neckline should result in a rapid burst of selling momentum. More aggressive traders may consider selling short a partial position of IWM just below yesterday's low, then adding to the position on confirmation of the break of the neckline. A logical protective stop is over the high of the right shoulder, as the 200-day MA has been acting as firm resistance. If IWM does break below its neckline, the price target would be equal to the distance from the top of the head down to the neckline. In this case, that equates to a drop of approximately six points below the neckline. That would put IWM down to the $60 level which, curiously, equates to support of the October 2005 low. The S&P Midcap 400 SPDR (MDY) has a similar chart pattern to IWM, so the trigger is below its neckline, stop above the right shoulder, and target of distance from the top of the head down to the neckline:

We showed you the head and shoulders patterns on MDY and IWM not only because they are good potential short setups, but also because their patterns say a lot about the market's overall health right now. You can be assured that IF they follow through and break their necklines, the momentum will lead all the other indices much lower as well. Until the market proves otherwise, long is still wrong!
Deron Wagner is the Founder and Head Trader of both Morpheus Capital LP, a U.S. hedge fund, and Morpheus Trading Group, a trader education firm launched in 2001 that provides daily technical analysis of the leading ETFs and stocks. For a free trial to the full version of The Wagner Daily or to learn about Wagner's other services, visit MorpheusTrading.com or send an e-mail to deron@morpheustrading.com.