Stocks attempted to build on the gains of the previous two days, but the buying interest dried up in the afternoon, causing the major indices to drift back down to near the flat line. The S&P 500, Dow Jones Industrial Average, and the S&P Midcap 400 indices each finished less than 0.1% lower, while the Nasdaq Composite slipped 0.2%. Small cap stocks showed the most relative weakness, as the Russell 2000 Index lost 0.4%. Each of the major indices closed near the middle of their intraday ranges, indicating indecision into the close.
Total volume in the NYSE increased by 4%, while volume in the Nasdaq was 7% higher than the previous day's level. Technically, the broad market experienced a bearish "distribution day" because the major indices closed lower on higher volume. However, the volume increase was minimal and the losses in the broad market were insignificant, so it would be a bit misleading to say there was a lot of institutional selling taking place. The fact that market internals actually closed slightly positive confirms this thought. In both the NYSE and Nasdaq, advancing volume marginally exceeded declining volume levels.
As for the major industry sectors, yesterday was pretty mixed. On the upside, the oil and gold commodities were strong. The Oil Service Index ($OSX) and Amex Oil Index ($XOI) gained 2.7% and 1.7% respectively. The Gold and Silver Index ($XAU) turned in a respectable gain of 1.5%. If you glance at the daily charts of both the $OSX and $XOI indexes, you will notice an interesting price divergence has been taking place. While the $OSX remains 14% below its 52-week high, the $XOI index actually closed at a fresh all-time high yesterday. This tells us that money has been flowing into the oil refiners and producers more than the oil service stocks. To illustrate this, take a look at the daily percentage change chart below that overlays the $OSX with the $XOI and notice the price divergence since the June 13 lows:
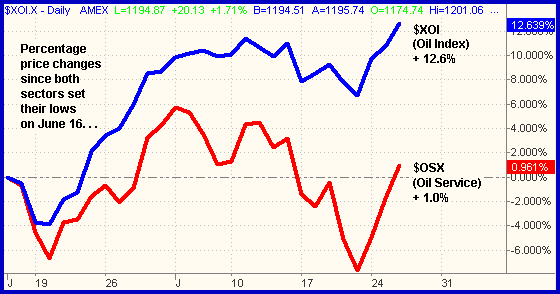
Overlay charts that illustrate the differences in percentage change are a great way to quickly spot relative strength or weakness within specific industry sectors. Upon spotting the relative strength or weakness, you can be sure you are positioned long in the sectors with the most relative strength or short those with relative weakness to the broad market.
In addition to the solid gains in the oil and gold sectors, both the Utilities ($DJU) and Pharmaceuticals ($DRG) continued to act well. Both sectors gained only 0.5% yesterday, but they continued to build on their recent gains. The $DRG index closed at a new 52-week high for the third consecutive day, while the $DJU has closed higher for the ninth day in a row. As we discussed over the past several days, both sectors are acting great and we like the idea of buying their respective ETFs on the first decent pullback. The Utilities HOLDR (UTH) and the Pharmaceuticals HOLDR (PPH) are the most popular ETFs in those sectors. We are presently stalking both of them for potential long entries if we see low-risk entry points. Given that the broad market is still in a confirmed downtrend, we're definitely not interested in chasing any long positions that are extended.
On the downside, the DJ Transportation Average ($DJT) continued to show relative weakness by falling 2.8% yesterday. The drop caused the iShares DJ Transportation Average (IYT) to close below its 200-day moving average for the first time since October 18, 2005. We mentioned last week that we were beginning to see relative weakness in the transportation stocks and this has now been confirmed. Looking at the daily chart of IYT below, notice how it not only closed below its 200-day moving average, but has had numerous days of high volume losses over the past three weeks as well:
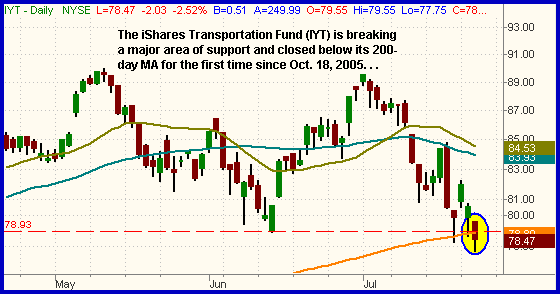
Given the overall weak market environment and the relative weakness in IYT, we like the idea of selling short the transportation stocks and ETFs into the next bounce. One could also consider selling short the break of the 200-day moving average support level, but it is always higher risk to short a breakdown rather than waiting for the first bounce after the break of support.
The bigger picture of the broad market remains bearish in the intermediate-term. Since putting in a short-term bottom on July 18, the major indices have attempted to rally, but tech sectors such as the Semiconductors remain dead. With techs so weak, it is unlikely the Nasdaq will rally, which makes it difficult for the other indices to sustain any gains as well. If the S&P 500 can break out above its July 3 high of 1,280, our bias would become more positive, but the index technically remains in a primary downtrend until that happens. Most key companies that have reported quarterly earnings over the past two weeks have seen negative price reactions in their stocks the following day. Clearly, this doesn't help the situation either. We are not bearish on the market simply to be different or to try to be right. Rather, we are merely following the primary trends. It's a corny and overused Wall Street expression, but the trend really is your friend! Don't fight it and you will always be rewarded in the long-term.
Deron Wagner is the Founder and Head Trader of both Morpheus Capital LP, a U.S. hedge fund, and Morpheus Trading Group, a trader education firm launched in 2001 that provides daily technical analysis of the leading ETFs and stocks. For a free trial to the full version of The Wagner Daily or to learn about Wagner's other services, visit MorpheusTrading.com or send an e-mail to deron@morpheustrading.com.


 Free Festival of Traders Videos