After beginning the day with an opening gap higher, the bears attacked again and sent stocks lower, but a solid reversal in the final ninety minutes of trading pushed stocks back into positive territory. Small caps rebounded nicely, as the Russell 2000 Index turned an intraday loss of 1.0% into a closing gain of 0.6%. The Nasdaq Composite similarly showed a loss of 1.2% at its worst level, but finished with a 0.3% gain. The S&P 500 advanced 0.2% and the Dow Jones Industrial Average rallied 0.5%, but the S&P Midcap 400 continued to show relative weakness and gained less than 0.1%. The intraday price pattern of the broad market was indicative of a bullish reversal day that often occurs after an extended downtrend.
Confirming yesterday's bullish price pattern was a healthy rise in turnover across the board. Total volume in the Nasdaq surged 32% higher, while volume in the NYSE was 18% higher than the previous day's level. The broad market's gains on higher volume means yesterday was an "accumulation day" that signaled institutional buying. When this occurs in combination with the type of intraday reversal patterns that we saw yesterday, it usually leads to further upside momentum, at least in the short-term. Stocks collapsed immediately after the S&P 500 had its last "accumulation day" on July 11. When the market is very weak, "accumulation days" that occur after stocks have bounced off their lows are often the result of institutional selling into strength rather than buying interest. But yesterday's high volume gains occurred at the bottom of an extended downward move, which represents institutional buying into weakness as opposed to selling into strength. Market internals finished positive, but not by a wide margin. Nevertheless, the advancing/declining volume ratios recovered from the rather negative levels that were present at mid-day.
Yesterday morning's weakness caused our short position in the S&P Midcap SPDR (MDY) to reach our original price target. As such, we covered the remaining shares for a gain of more than 7 points. Within one hour of trading down to our target price, MDY began to reverse with the broad market and actually closed nearly 1.5 points higher than where we covered the position. One subscriber subsequently e-mailed us, asking how we originally determined an accurate downside price target on the trade setup. Rather than e-mailing that person a direct response, we thought the subject would be an interesting educational blurb to cover in today's Wagner Daily. The daily chart below illustrates our entry and exit points on the trade, while the commentary that follows explains the original premise of the setup:
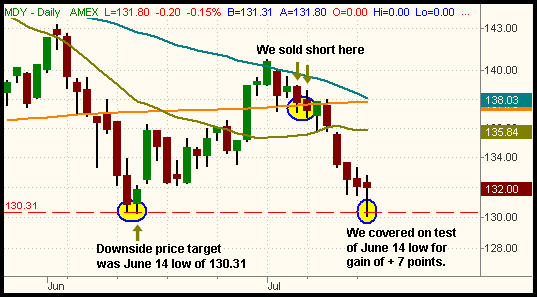
We originally sold short MDY on July 7, then subsequently added 50% more shares on July 10, giving us an average price of 137.69 on the full position. At the time of the initial entry, the broad market had begun to show signs that its prior rally was running out of gas. The key signal was the relative weakness in the Semiconductor Index ($SOX), which had already fallen below its prior low from June and was dragging down the Nasdaq. Further, breakouts began failing again and overall volume was increasing near the highs. This combination of factors told us it was time to re-short one of the broad-based ETFs into the bounce off the June lows. To determine which one, we simply looked at relative weakness and determined that MDY was lagging the most on the way back up and dropping the most on the down days. The specific impetus that caused us to sell short on July 7 was that MDY had dropped back down to its 200-day moving average (the orange line), after being unable to rally above its 50-day MA (the teal line). We anticipated that MDY would fall apart quickly if the broad market weakness continued because it had already dropped back down to its 200-MA. However, we wanted confirmation that it would not probe below the 200-MA and reverse sharply higher the next day. On the morning of July 10, MDY briefly attempted to rally, but it sold off again and closed below its 200-day MA. This gave us the confirmation we were looking for, so we added to the position at that point.
The initial protective stop price of MDY was 140.39. We determined this price by simply placing the stop above resistance of the 50-day moving average. Since the 50-MA previously stopped the rally on July 3, a second attempt to break through the 50-MA that succeeded would likely lead to much higher prices. Therefore, we wanted to be out quickly if the 50-MA was violated. Fortunately, that never happened. As MDY began to drop in the days that followed, we trailed our stop lower to maximize the gains while protecting the profits. A variety of factors were used to determine where to trail the stop, but resistance of the hourly downtrend line was used as a basis.
Getting back to the original question from our subscriber. . .How did we determine the target price? For trades with an average hold time of several days to a few weeks, we find that keeping it simple and focusing on the last significant low tends to provide support (or the last significant high if you are going long). At the time of our entry, the last significant low that was set before MDY rallied was the June 14 low of 130.31. If MDY began dropping hard, that was an area that had very good odds of generating a reversal of momentum. MDY worked out to be a textbook-like example, as it touched its prior significant low yesterday and reversed right at support of that level. This, of course, does not mean that MDY will not go lower, but it served as the ideal place to cover your short position if you were not willing to hold through a potential retracement in the opposite direction.
In yesterday's session, three of the five major indices we follow touched support of their prior lows before reversing: the S&P Midcap 400, the small-cap Russell 200, and the Dow Jones Industrial Average. The S&P 500 still remains above its prior low from June, while the Nasdaq has been trading below it for some time. Based on yesterday's bullish reversal action, we are likely to see at least a few days of price gains in the broad market from here. It's too early to speculate how long the bounce will last, but caution on the short side is definitely in order here. Keep those stops tight to prevent any short positions from quickly rallying back to your initial entry points. Conversely, there is no reason to go long and buy ETFs either, but that time may come if stocks begin breaking their hourly downtrend lines. As always, we'll keep you abreast of anything that looks good for potential buys. Remember that earnings season tends to affect technical patterns as well. Yahoo! (YHOO) reported earnings after yesterday's close and had a negative impact on the Nasdaq futures in the after-hours, so we'll see whether or not the market shakes off the overnight weakness. We like being in cash right now, ready to pounce on either side of the market, but without the risk of getting caught on the wrong side.
Deron Wagner is the Founder and Head Trader of both Morpheus Capital LP, a U.S. hedge fund, and Morpheus Trading Group, a trader education firm launched in 2001 that provides daily technical analysis of the leading ETFs and stocks. For a free trial to the full version of The Wagner Daily or to learn about Wagner's other services, visit MorpheusTrading.com or send an e-mail to deron@morpheustrading.com.


 Free Festival of Traders Videos