Stocks got off to a wobbly start yesterday morning, but an impressive reversal in the final two hours of trading enabled the major indices to close with moderate gains. The Nasdaq Composite, down as much as 1.0% intraday, showed relative strength for a change and finished 0.6% higher. The S&P 500 and Dow Jones Industrial Average both followed similar intraday patterns and gained 0.4% and 0.3% respectively. Small caps perked up, causing the Russell 2000 Index to rally 0.8%, while the S&P Midcap 400 advanced 0.4%. Each of the major indices closed near their best levels of the session, a distinct change from the recent pattern of late-day weakness. The morning weakness caused our long positions in the DJ Real Estate Index (IYR) and the Telecom HOLDR (TTH) to hit their trailing stops, but we still netted a profit on both of them.
For the first time since the broad market registered strong gains on June 29, both exchanges registered bullish "accumulation days." Total volume in the NYSE was 24% higher than the previous day's level, while volume in the Nasdaq increased by 27%. "Accumulation days," which occur when the broad market advances on higher volume, are indicative of institutional buying. More than half of the stock market's daily turnover is the result of trading activity from mutual funds, hedge funds, pensions, and other institutions. As such, volume spikes in the market are the footprint of institutional trading activity. The price action of stocks on those days tells us how the market is behaving "under the hood." When a market closes higher and on higher volume, it is known as an "accumulation day." Conversely, a "distribution day" occurs when stocks close lower, but on higher volume. Following the broad market's price to volume action on a daily basis is a great way to know what the "smart money" is doing before Joe Public finds out.
Just as quickly as we showed you how the Semiconductor Index ($SOX) had fallen below its 200-week moving average, it snapped back above it in yesterday afternoon. Sudden strength in the $SOX was certainly a major reason for the broad market's late days reversal. The $SOX recovered all of its previous day's losses and then some by rallying 3.3%. Of all the industry sectors we follow, it was the top percentage gainer yesterday. Nevertheless, there is no technical reason to begin buying semiconductor stocks unless your time horizon is very short and you are capable of selling into strength while maintaining tight stop losses. Although the semis may see a few days of follow-through momentum to the upside, there remains a lot of overhead supply within the sector. When the market reverses, you should focus on stocks and ETFs that were showing the most relative strength when the broad market was weak. These, as opposed to stocks and ETFs near their lows, are usually the ones that make the biggest gains.
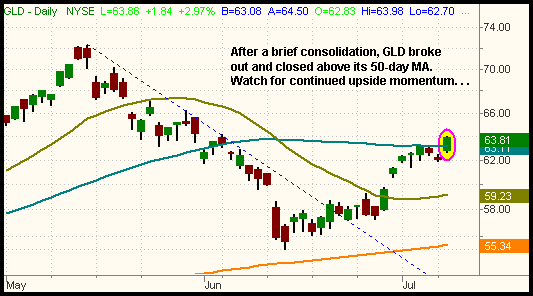
Curiously, the commodities-related sectors posted the biggest gains outside the Semiconductors. The Oil Service Index ($OSX) surged 3.0%, while the Gold Index ($GOX) gained 2.7%. A couple of ETFs that track commodities are also starting to look pretty bullish on the long side again. We bought the StreetTRACKS Gold Trust (GLD) when it broke out above its daily downtrend line on June 21, then sold it into strength for nearly a five-point gain when it rallied into its 50-day moving average four days ago. Although we closed the position due to resistance of its 50-day MA, we have been continuing to monitor its performance over the past several days. After a brief, two-day pullback, GLD rallied again and broke out above its 50-day MA yesterday. Ideally, we would like to see it consolidate in a narrow, sideways range above its 50-MA, for at least the next one to two weeks, as that would build a base of support from which GLD could stage its next leg higher. Regardless, spot gold and the Gold Trust are continuing to show nice relative strength since breaking out above that downtrend line last month. We feel it is relatively low risk to be long GLD, just as long as your stop is not much below new support of the 50-MA:

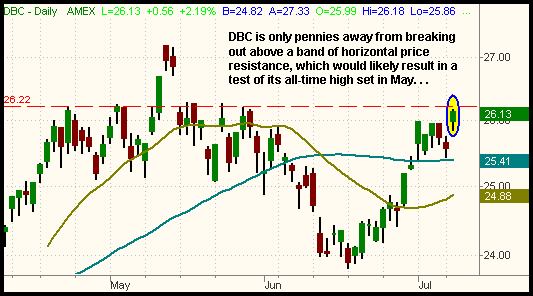
The DB Commodity Index (DBC) is another commodity-based ETF that is showing a bullish chart pattern. It corrected along with the broad market throughout May and June, then broke out above its primary downtrend line at the end of June. Since then, it has already recovered nearly two-thirds of its loss from the May to June correction, putting it above the pivotal 61.8% Fibonacci retracement level. DBC broke out above its 50-day moving average on July 3, then subsequently consolidated in a narrow range for four days before breaking out above that range yesterday. It closed yesterday at its highest price since May 12, which was only one day after DBC set its all-time high. Looking at the chart below, notice how DBC is poised to break out above a major area of horizontal price resistance. If it does, we will probably see a retest of the May high pretty rapidly:
 Outside of Semiconductors and Commodities, the gains in other sectors were relatively mild. A handful of sectors also closed lower yesterday, confirming the mediocre breadth readings of the market internals. Airlines ($XAL) and Home Construction ($DJUSHB) both shed 1.5%, while Retail ($RLX) and Telecom ($XTC) each fell 0.5%. Pharmaceuticals ($DRG), Transportation ($DJT), Insurance ($IUX), and Computer Networking ($NWX) were all modestly lower.
Genentech (DNA) announced the results of their quarterly earnings after the close and they exceeded analyst estimates. However, sales of a key drug came in below estimates, prompting a negative reaction in its stock price in the after-hours session. Genentech was the first of the Nasdaq giants to report its quarterly earnings, but many more are on tap over the next several weeks. Genzyme (GENZ), another key biotech company, reports tomorrow as well, so the biotechs may see some action over the next several days. Next week, be on the lookout for earnings reports from IBM, Motorola, Qualcomm, Amgen, and Broadcom, just to name a few.
Deron Wagner is the Founder and Head Trader of both Morpheus Capital LP, a U.S. hedge fund, and Morpheus Trading Group, a trader education firm launched in 2001 that provides daily technical analysis of the leading ETFs and stocks. For a free trial to the full version of The Wagner Daily or to learn about Wagner's other services, visit MorpheusTrading.com or send an e-mail to deron@morpheustrading.com.