News of North Korea's missile testing caused the major indices to gap open below their prior day's lows, but stocks maintained equilibrium throughout the remainder of the session. With ninety minutes remaining, the broad market attempted to rally, but the bears regained control in the final hour. Relative weakness in the tech arena caused the Nasdaq to slide 1.7%. Both the small-cap Russell 2000 and S&P Midcap 400 indices similarly sustained losses of 1.5%. Strength in Oil, the only major sector to close higher, helped reduce the losses in the S&P 500 and Dow Jones Industrial Average, both of which lost 0.7%.
Since the stock market closed early in the previous session, turnover was obviously a lot higher yesterday. Total volume in the NYSE increased by 103%, while volume in the Nasdaq was 115% higher than the previous day's level. As of 1:00 pm EDT, which is when the markets closed on Monday, volume in the Nasdaq was 14% higher and the NYSE was 5% higher. Therefore, we could reasonably conclude that yesterday was a bearish "distribution day." Negative market internals confirmed the institutional selling. In the Nasdaq, declining volume exceeded advancing volume by more than 6 to 1, while the NYSE ratio was negative by 3 to 1.
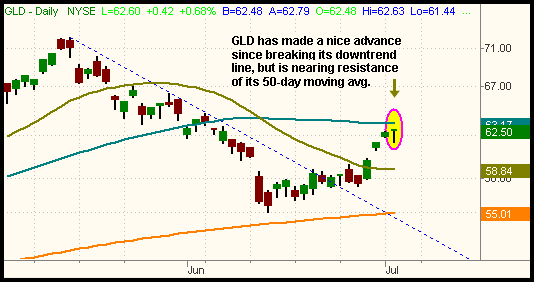
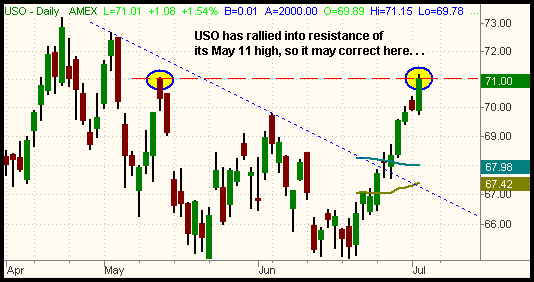
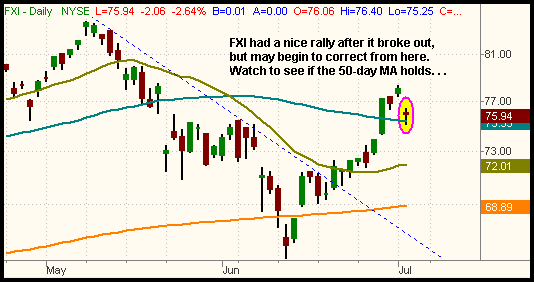
In the beginning of last week, we pointed out three different ETFs that were showing relative strength and mentioned they were good candidates for further upside momentum. All three of those ETFs have indeed continued to advance since then, but each one has rallied to a key resistance level that will likely result in a pullback. If you bought any of them and are still long, you may consider tightening your stops or selling into any further strength. In no particular order, those ETFs were: StreetTRACKS Gold Trust (GLD), the U.S. Oil Fund (USO), and the iShares Xinhua China 25 Index (FXI). We have illustrated each of those resistance levels on the daily charts below. First, take a look at GLD:

We bought GLD on June 21 when it closed above resistance of its six-week downtrend line. We explained to subscribers that our upside price target was simply a retracement up to resistance of the 50-day moving average. As you can see, GLD closed yesterday right below that 50-MA. We already sold half of the position into strength on July 3 and intend to sell the rest on any test or probe above the 50-MA. Alternately, we will take profits on the remaining shares if GLD begins to lose support of its two-day consolidation. Next is a chart of USO, which mirrors the price of the Crude Oil commodity:

We pointed out the setup in USO when it closed above its downtrend line on June 27. Since then, momentum has carried it steadily higher, but it closed yesterday at horizontal price resistance of its prior high from May 11. Most likely, USO will take a rest and either consolidate or pullback before breaking out above that level. If you're not willing to hold through any potential correction or want to play it conservatively, consider taking profits here. Last is FXI:

Just like GLD and USO, momentum from a break of its downtrend line enabled FXI to cruise steadily higher over the past two weeks. However, FXI has already begun to correct. It gapped down yesterday and failed to recover intraday. Support of the 50-day MA converges with yesterday's low, which is positive, but be careful with FXI if it fails to hold above that 50-MA.
Despite yesterday's correction in the broad market, our short-term bias remains bullish overall. Many leading stocks are holding their recent gains and breakouts are still holding. The S&P 500 slid back below its 50-day MA, but the 200-day MA is just below yesterday's low. Unless it drops back below the 200-MA, we would not aggressively mess with the short side of the market. We're certainly not "out of the woods," and our intermediate-term bias remains bearish, but it seems the market still has enough momentum for continuation of the recent rally.
Deron Wagner is the Founder and Head Trader of both Morpheus Capital LP, a U.S. hedge fund, and Morpheus Trading Group, a trader education firm launched in 2001 that provides daily technical analysis of the leading ETFs and stocks. For a free trial to the full version of The Wagner Daily or to learn about Wagner's other services, visit MorpheusTrading.com or send an e-mail to deron@morpheustrading.com.