Stocks wrapped up an ugly week on a positive note, as the major indices reversed morning losses to finish the day higher. A 3.2% gain in the Semiconductor Index ($SOX) helped the Nasdaq to snap its eight-day losing streak and finish 0.6% higher. The small-cap Russell 2000 Index also advanced 0.6%, but we covered our short position in the iShares Russell 2000 (IWM) for more than a two-point gain during the morning weakness. The S&P 500 and Dow Jones Industrial Average closed higher by 0.4% and 0.1% respectively. Although gains in the S&P and Dow were less substantial, bear in mind that both indices also dropped much less than the Nasdaq since the selloff began. The S&P Midcap 400 also lagged behind the Nasdaq with only a 0.2% gain. For the week, the Nasdaq fell 2.2%, the S&P 500 1.9%, and the Dow Jones 2.1%. The Nasdaq now stands 7.5% below its 52-week high that was set last month and is down 0.6% for the year. The S&P 500 is 4.4% off its high that was set only on May 5, but is still showing a 1.5% gain for 2006.
Turnover rose across the board last Friday, giving the broad market its first day of higher volume gains in more than two weeks. Total volume in the NYSE increased by 20%, while volume in the Nasdaq was 22% higher than the previous day's level. By definition, the higher volume gains made it a bullish "accumulation day," but the excessive number of "distribution days" since May 10 has created a lot of overhead supply. Only a string of additional "accumulation days" would enable stocks to make a sustainable advance. Conversely, any further bouts of institutional selling would likely cause the broad market to slide back below last Friday's low, undoing the benefit of the accumulation.
Looking at the charts, Friday's modest rally did not change the "big picture" of the market. Even the three percent gain in the $SOX was insignificant because the index had fallen ten percent throughout nine consecutive days of losses. Overall, the broad market's gains appeared to have been the result of a technical bounce from oversold conditions. Each of the major indices remain firmly in their downtrends that began two weeks ago and have not yet given us any clear signals that the selling is finished.
Going into this week, the question on everyone's mind is, "How high will the market bounce?" First of all, despite remaining extended to the downside, there is nothing that says the market must bounce any higher before sliding to new lows. However, if it does bounce further, it is wise to be aware of the major resistance levels so that you are prepared to establish new short positions with a positive risk/reward ratio for entry. Selling short into the next bounce is much less risky than attempting to buy stocks and ETFs because the major indices would have to recover back above their 50-day moving averages before long positions would become a good bet. Of the major indices, the Nasdaq Composite has the most obvious overhead resistance level, which is convergence of its 200-day moving average and its prior low from February:
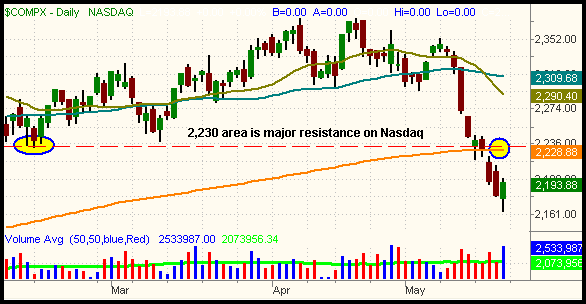
As the chart above illustrates, it will be difficult for the Nasdaq to reverse back above the 2,230 level in the short-term, so we view any rally into that area as a good opportunity to initiate new short positions in the relatively weak Nasdaq stocks and ETFs. Next, take a look at the daily chart of the S&P 500:
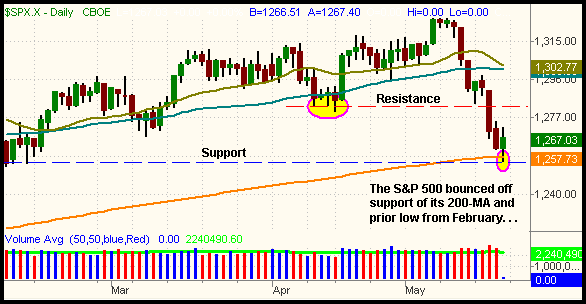
The positive is that the S&P bounced off support of its 200-day MA on Friday. Notice how the 200-MA also converges with support from the prior lows of February (as indicated by the dashed blue line). While the S&P may hold support at this level for a while, it is unlikely to advance above new resistance of last month's lows at the 1,280 to 1,285 area (circled in pink). Even if it does, resistance of the 20 and 50-day moving averages loom above the 1,300 level.
In a choppy, range-bound market, such as the one we have had throughout most of this year, it is difficult to profit from both long and short positions because trends never last more than a few days. But since May 10, most stocks and ETFs have been trending very smoothly, enabling us to sell short on the bounces and cover into weakness. Sure, it is always a bit easier to play the long side of the market because the reversals tend to be less violent, but we're just happy that the market finally seems to be establishing a new trend. Obviously, nobody knows how long the new downtrend will last, but we recommend that "trend traders" take advantage of the current volatility before stocks decide to enter a sideways range again. In general, we have price alerts on the relatively weakest stocks and ETFs of the past few weeks and are patiently waiting for low-risk entry points on the short side. Specifically, we are planning to sell short on rallies into resistance of their prior highs on the hourly charts. Until the market proves otherwise, we need to assume the current trend that has been established will continue. It's an overused and cheesy clichĂƒÂ©, but now more than ever, it's crucial to remember that the trend really is your friend!
Deron Wagner is the Founder and Head Trader of both Morpheus Capital LP, a U.S. hedge fund, and Morpheus Trading Group, a trader education firm launched in 2001 that provides daily technical analysis of the leading ETFs and stocks. For a free trial to the full version of The Wagner Daily or to learn about Wagner's other services, visit MorpheusTrading.com or send an e-mail to deron@morpheustrading.com.


 Free Festival of Traders Videos