A weak earnings report from Microsoft after the previous day's close caused the Nasdaq to fall last Friday, but most of the major indices still finished higher. After gapping down to start the day one percent lower, the Nasdaq Composite attempted to reverse and "fill the gap," but the rally attempt fizzled after the first hour. This caused the index to drift back down to its opening low and post a 1% loss by day's end. Conversely, small and mid-cap stocks held up well. Both the Russell 2000 and S&P Midcap 400 indices finished 0.4% higher. The S&P 500 managed a 0.1% gain, but the Dow Jones Industrials slipped lower by the same percentage. For the week, the S&P 500 lost less than 0.1%, but the Nasdaq Composite dropped 0.9%. In the full month of April, the divergence between the two indices was even greater. The S&P 500 gained 1.2% while the Nasdaq shed 0.7%. When the major indices are out of sync with each other, it usually results in choppy and erratic trading that lacks momentum. Certainly, that is a good way to describe April's price action (and March's too for that matter).
Helping ease the blow of Friday's loss in the Nasdaq was that total volume in the exchange came in 3% lighter than the previous day's level. The drop in turnover prevented the tech-heavy index from registering another "distribution day," which would have indicated institutional selling. Volume in the NYSE declined by 14%. Not surprisingly, market internals were mixed alongside the major indices. In the NYSE, advancing volume exceeded declining volume by a margin of just under 3 to 2, but the ratio in the Nasdaq was negative by nearly 5 to 2. Still, that Nasdaq's advancing/declining volume ratio was not overly bearish considering the 1% drop in the index. Because Microsoft is the most heavily weighted stock in the Nasdaq, its 11% decline on Friday was solely responsible for much of the Nasdaq's loss.
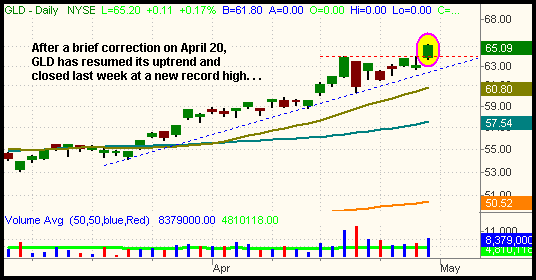
Underneath a relatively flat S&P, a handful of industry sectors made substantial moves last Friday. A new 25-year high in the price of spot gold enabled the StreetTRACKS Gold Trust (GLD) to rally 3.4% and break out to a new high as well. The April 20 correction in gold and the gold mining stocks was short-lived and is a good example of how stocks and ETFs at new highs can easily continue much higher simply due to a lack of overhead supply. So far, the strength in the gold sector shows no signs of abating any time soon (and don't forget about the new silver ETF, SLV):

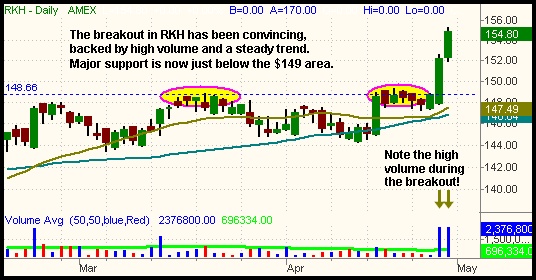
Last Thursday's breakout in the Banking Index ($BKX) that we brought to your attention in the April 28 issue of The Wagner Daily continued higher on Friday. The $BKX index gained 1.9%, enabling the Regional Bank HOLDR (RKH) and the S&P Select Financial SPDR (XLF) to move higher by 1.8% and 1.0% respectively. It's nice to see that both of these ETFs not only held on to their gains, but continued higher in Friday's session. With the exception of oil and gold-related ETFs, nearly every sector over the past month has whipped in the opposite direction the day following a substantial move. The Oil and Oil Service sectors are currently in correction mode, so perhaps we will see further sector rotation out of oil and into the banking sector. We are now stalking the banking ETFs for a long entry on the first correction, which may occur in the form of either a price retracement or a correction by time (consolidation). In RKH, the prior high around 149 should now act as firm support, although we probably will not see a correction all the way back down to the breakout level. A Fibonacci retracement of 38.2% to 50% from the breakout level will provide a low-risk entry point on the long side:

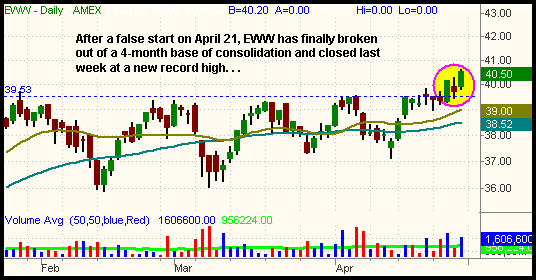
In the April 20 issue of The Wagner Daily, we pointed out a bullish setup in the iShares Mexico ETF (EWW). At the time, it was poised to break out to a new high from a four-month base of consolidation. We subsequently bought EWW the following day when it traded above the high, but we scratched the trade the following day because the lack of immediate follow-through put the setup in jeopardy of being a false breakout. However, EWW has been acting much better since then and closed last week at a new record high. We bought a small position in our hedge fund on Friday, but did not make it an "official" call yet because we first wanted to see a little more price confirmation. Nevertheless, you might consider buying EWW now that it finally had a weekly close above the four-month trading range. Despite the breakout, we are still using a tight stop just below the 20-day moving average on this play:

As for the major indices, nothing has substantially changed since our last analysis of the S&P and Nasdaq. For the S&P 500, the 1,310 level remains a key area of resistance that the index has failed to hold above on numerous occasions over the past seven weeks. Until it convincingly breaks out of that range, we must remain cautious with new long positions. The relative weakness in the Nasdaq provides further reason to reduce your share size and quantity of positions on the long side. Yet, the Nasdaq remains in a choppy, sloppy trading range as well. Keep an eye on the 2,312 level, ten points below last Friday's close, as that represents support of the 50-day moving average. A break below that could trigger a wave of downside momentum, particularly in the tech arena. As short-term trend traders, we would be equally fine with a breakout to new highs or a breakdown below support, as either one should result in the development of a new trend. But as it has been for the past two months, steady trends remain few and far between, continuing to challenge both short-term momentum and trend traders.
Deron Wagner is the Founder and Head Trader of both Morpheus Capital LP, a U.S. hedge fund, and Morpheus Trading Group, a trader education firm launched in 2001 that provides daily technical analysis of the leading ETFs and stocks. For a free trial to the full version of The Wagner Daily or to learn about Wagner's other services, visit MorpheusTrading.com or send an e-mail to deron@morpheustrading.com.