Yesterday's volatile session resembled a wild roller coaster ride, but the major indices eventually finished mostly higher. After beginning the day with an opening gap down to a fresh one-week low, the Nasdaq Composite swiftly reversed and surged back up to the previous day's high, but sellers stepped in just as quickly and sent the index back down to negative territory. The bulls again arrived on the scene and sent the Nasdaq to new intraday highs, but the rally began to fizzle out at mid-day and caused the index to close just above the middle of its intraday range. The other major indices followed similar tug-of-war patterns. The Nasdaq Composite closed with a 0.5% gain, while both the S&P 500 and the Dow Jones Industrials advanced 0.3%. The negative was that small-cap stocks showed major relative weakness and completely ignored the broad-based rally attempt. As such, the Russell 2000 Index actually lost 0.5%. Mid-cap stocks also diverged from the broad market, as the S&P Midcap 400 was unchanged.
As we often see on reversal days, volume spiked higher across the board. Total volume in the NYSE rose by 17%, while volume in the Nasdaq zoomed 43% above the previous day's level. Curiously, according to our research, yesterday was the highest volume day in the Nasdaq since December 7, 2004! It's positive that the market gained on such higher volume yesterday, but market internals were rather weak. In the NYSE, declining volume fractionally exceeded advancing volume. The Nasdaq ratio was positive, but only by 3 to 2. Considering the huge volume spike, we would have expected to see really strong internals on an up day, but divergent losses in the small and mid-caps were likely the culprit for weak market internals.
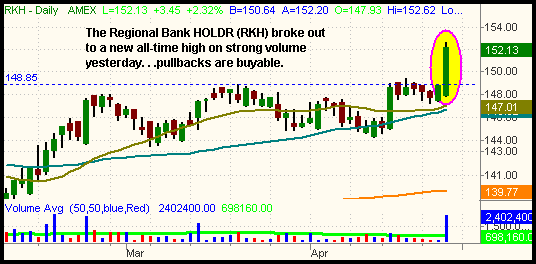
Many oil and metal stocks sold off pretty sharply yesterday, telling us that those sectors may be starting a correction. If long, be sure to trail tight stops from here. Gold, however, continues to hold up pretty well. One sector that may be starting to show new sector leadership is Banking. The Regional Bank HOLDR (RKH) broke out to a new all-time high yesterday on volume that was nearly 3.5 times greater than its 50-day average volume level:
Similarly, the S&P Select Financial SPDR (XLF) also broke out of a multi-month base of consolidation to a new high:
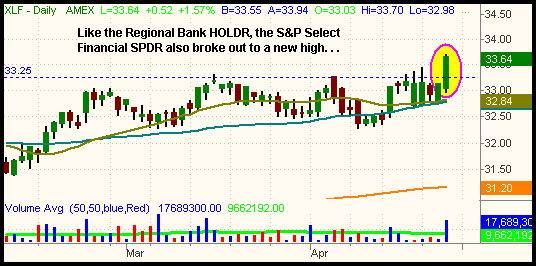
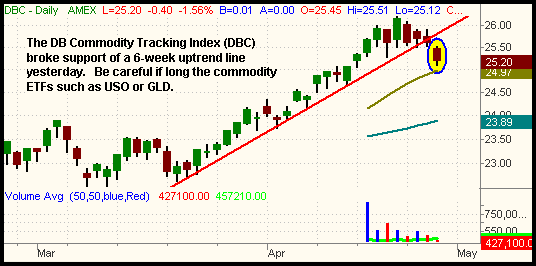
Because of yesterday's action in RKH and XLF, we would consider buying either of those ETFs, or stocks within those sectors, on any pullback above the breakout level. Conversely, the daily chart of the DB Commodity Tracking Index (DBC) shows that a correction may be taking place within the commodities. We are not advising shorting DBC, but just pointing out that gold, oil, and other metals may be near a short-term top. Notice how DBC closed yesterday below its daily uptrend line:
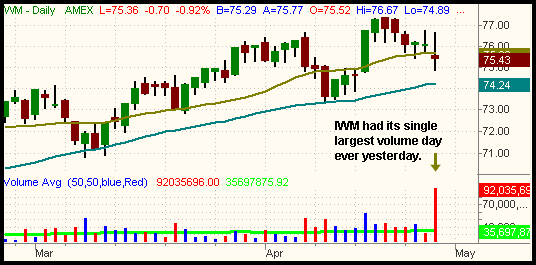
Like the massive volume spike in the Nasdaq yesterday, we found it very interesting that a handful of broad-based ETFs showed very high volume levels as well. Obviously, ETFs are synthetic instruments and their volume levels are not directly tied to the supply and demand of the ETF itself. Regardless, it's important to pay close attention to major changes in volume because it tells us what institutions may be doing. Volume in the iShares Russell 2000 Index (IWM), for example, swelled to 260% of its 50-day average volume yesterday. It was the single largest volume day in IWM since it began trading in June of 2000:
Both the Dow Jones Industrials (DIA) and the Nasdaq 100 Index (QQQQ) had their highest volume levels since January 20 of this year, while the S&P 500 SPDR (SPY) had its biggest volume since October 20, 2005:
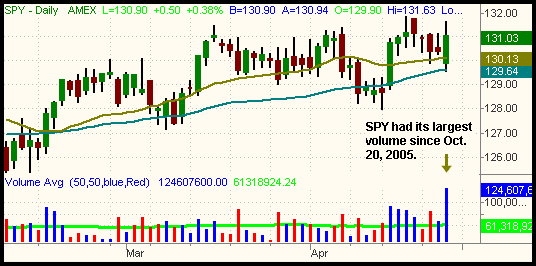
Unfortunately, one can only speculate and debate the meaning of these volume spikes in the broad-based ETFs. At the very least, it definitely tells us that mutual and hedge funds suddenly began to show an interest in taking positions in the broad market. Most likely, there is some hedging going on, but against what? Typically, such high volume levels occur near intermediate-term tops and bottoms, as institutions always begin to buy and sell their positions ahead of the general public. As an example, notice how many stocks and ETFs also showed similarly high volume right before the market put in a bottom in October 2005. The only thing we can definitively conclude from yesterday's diverse volume spikes is that a big move in either direction is likely to happen in the near future. Such an occurrence would certainly be a welcome reprieve from the months of choppy conditions.
Finally, the long-awaited launch of the new iShares Silver Trust (SLV), which tracks the price of the silver commodity, is expected to launch today. One share of SLV will represent 10 ounces of silver held in a vault. We are pleased that silver now joins the list of other commodities being traded as ETFs.
Deron Wagner is the Founder and Head Trader of both Morpheus Capital LP, a U.S. hedge fund, and Morpheus Trading Group, a trader education firm launched in 2001 that provides daily technical analysis of the leading ETFs and stocks. For a free trial to the full version of The Wagner Daily or to learn about Wagner's other services, visit MorpheusTrading.com or send an e-mail to deron@morpheustrading.com.