The markets moved lower across the board yesterday as a huge slew of earnings reports which were mostly positive failed to move the markets. After opening up slightly higher, the markets stayed in a holding pattern until 10:00 am EST awaiting the Consumer Confidence and Housing Starts figures. Interestingly enough, both of these beat consensus estimates and came in ahead of prior period readings but the market construed the news as negative and sold off regardless. Remember that it's always the markets reaction to economic news and not the news itself that is of note. By the time the bell rang, both the Dow and S&P managed to erase 0.5%, while the Nasdaq fell 0.1% in its fourth straight day of losses. Selling was pretty much across the board and broad-based with almost all sectors in the red, most notably, the $DJUSHB (Dow Jones U.S. Homebuilders Index) losing almost 2% from the open and the $GIN (Goldman Sachs Internet Index) off by the same. Oils, oil services and biotechs were also weak. Some very small pockets of strength were found in mining stocks ($GOX) and also in semiconductors ($SOX) which held up pretty well despite the overall market's weakness.
In yesterday's commentary we noted that it was relatively positive that overall volume levels declined yesterday during a mild selloff. This we construed as positive because it meant that we did not record a bearish distribution day on Monday. Unfortunately the reading on Tuesday's trade is the opposite scenario as total turnover roared back to life, registering ahead by 11% on the NYSE and by 18% on the Nasdaq over Monday's figures. This is now the fifth day of higher volume loss that we have had in the Nasdaq within the past four weeks. As discussed in yesterday's commentary, the occurrence of more than four or five distribution days in a month should always be noted and is not a phenomena to be taken lightly.
In addition to the negative overall volume patterns in the Nasdaq as of late, there are other clear signals that the tech-heavy index may be showing signs of an impending correction soon. One of the best ways for traders to gauge overall market sentiment is simply to periodically scan through sectors that are heavily weighted in the index on longer term charts such as weeklies. If it becomes apparent that a majority of the sectors are beginning to show bearish patterns then the odds of a rollover in the entire index become stronger. When we think Nasdaq, we usually think of three main sectors. Those being Semiconductors ($SOX), Internets ($GIN), and Biotechs ($BTK). Without question, its these three that seem to get the most attention from investors and the media. Together they are a large percentage of the Nasdaq Composite. If the above three are not hitting on all cylinders it is quite difficult for the Nasdaq to get in gear. In yesterday's Wagner Daily we showcased a chart of the $SOX and analyzed its recent failure and what it means in the bigger picture for the Nasdaq Composite. Today we will go another step further and take a look at the internets and biotechs:

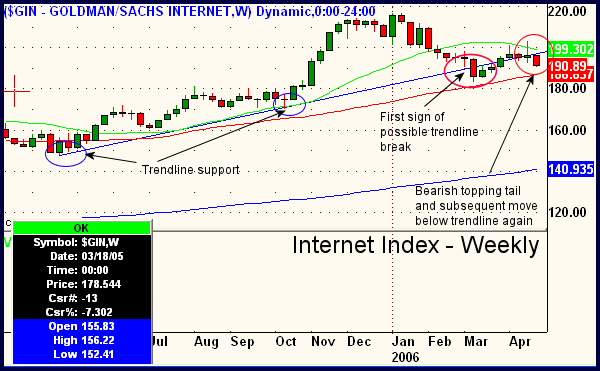
As you can see in the chart above the Internet Index is showing clear signs of rollover at this juncture. The first two blue circled areas show the index holding trendline support throughout most of 2005. Then in late February and early March there is a first dip below trendline support (first red circled area). Some technicians call these "scouting parties" as bears are just peeking over the line to see how the air is over there. Often the first break fails and we rally again. Notice, however, how weak the ensuing rally was in March to early April. It culminated in a bearish topping tail (second red circled area) which has since begun to follow through and move lower.

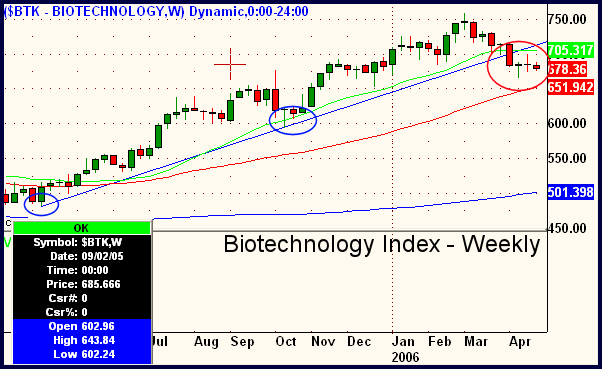
In the biotech chart above, its basically the same situation as the internets, if not a little worse though, because the pattern is actually "cleaner" with only a definitive trendline break at the red circled area and no chopping around on either side of the trendline. Notice how in the $BTK chart above there is a lot more "open space" between the 50 period moving average weekly (red line) and current prices than there is in the $GIN. Biotechs could easily move lower here and test that area at roughly 652 in the index. If either of the aforementioned sectors begins to follow through on these rollover patterns then it would certainly be negative for the Nasdaq in Q2.
As mentioned yesterday, we remain cautious on both sides of the market. The Dow and S&P remain out of sync with the relatively weaker Nasdaq which acting as a drag and causing overall choppy conditions currently. Be careful out there don't get married to any opinions you may have about general market direction. As always, trade what you see and not what you think.
Deron Wagner is the Founder and Head Trader of both Morpheus Capital LP, a U.S. hedge fund, and Morpheus Trading Group, a trader education firm launched in 2001 that provides daily technical analysis of the leading ETFs and stocks. For a free trial to the full version of The Wagner Daily or to learn about Wagner's other services, visit MorpheusTrading.com or send an e-mail to deron@morpheustrading.com